Article Text

Abstract
Objective This study described the spectrum of emergency department (ED) physician performance correlating annual workload, experience and facility issues.
Methods Retrospective review reported physician hours worked comparing productivity measures—patients per hour (PPH) or relative value unit (RVU) per hour, as ‘best fit’ trend line and facility volume subgroups by analysis of variance.
Results 912 physicians evaluated 2 407 833 patients in 61 ED. Staff productivity was 1.72±0.44 PPH (1.2±0.30–2.1±0.32 PPH) and 4.43±1.21 RVU/h (2.9±0.80–5.4±0.82 RVU/h). There was less variation with facility size 2.58±0.36 (2.41±0.22–2.72±0.37 RVU/visit) from smaller to larger (p<0.001). Maximal efficiency occurs at 5.0 RVU/h generated at 1550 annual hours (130 monthly) compared with 1800 h full-time equivalent (FTE) physicians (R2=0.084). Productivity begins at 4.0 RVU/h for casual (<250 h/year), 4.4 RVU/h for part time (<500 h), achieving equilibrium (5.0 RVU/h) for three-quarters to full time (1250–1800 h) with a decline in full-time providers (2000–2500 h/year). Efficiency was less in smaller ED less than 15 000 (1.22±0.30 PPH, 2.95±0.80 RVU/h) compared with larger greater than 45 000 (2.07±0.32 PPH, 5.43±0.82 RVU/h; p<0.001). The RVU/visit generated were less varied (2.41±0.22) in smaller versus (2.64±0.38) larger facilities with a 2.8 RVU/h equilibration point (p<0.001).
Conclusion Maximal productivity is reached at 86% (1550 h) annual workload and efficiency declines at conventional FTE (≈ 1800 h). A distinct ‘learning curve’ was found in newer, casual providers and smaller facilities.
- effectiveness
- efficiency
- emergency care systems
- emergency department
- patients per hour (PPH)
- relative value unit (RVU)
- staffing ratios
Statistics from Altmetric.com
- effectiveness
- efficiency
- emergency care systems
- emergency department
- patients per hour (PPH)
- relative value unit (RVU)
- staffing ratios
The ‘learning curve’ is the duration and nature of exposure to new knowledge or skills, and its resulting effectiveness of learned task performance. This construct was first described by Ebbinghaus,1 a 19th century German psychologist influenced by the British empiricists. He described improved learning with a repetition of a non-sensical syllabic string in 1885. He also described the decrement of knowledge as the ‘forgetting curve’.
The learning curve was quantified by Wright,2 a Unitarian theorist, who in 1936, proposed a mathematical model relating learning and labour productivity in the aircraft industry, subsequently expanded in second world war military planning. The production function finds that output is dependent on capital labour and technical progress where Q=F (K·L·TP).3 Although plied in the manufacturing trades, the learning curve also applies to the learned professions.
Another concept related to this model is that of ‘diminishing marginal productivity’ relating labour factors to a fixed plot of land described by Malthus4 in 1798. This agricultural productivity model was quantified by Clark5 in 1889. ‘Put only one man on a square mile of prairie and he will get a rich return. Two laborers on the same land and you will get less per man, and if you enlarge this factor to ten, the last man will get wages only.’
The more modern rendition of this concept is the ‘law of diminishing returns’, rendered by Hicks6 in 1934, focused not on the macroeconomic concept of average productivity (AP), in which the absolute ratio of output to labour (AP=Q/L) is monitored, but on the microeconomic concept of marginal productivity (MP), focusing on the change of output over the change in labour (MP=ΔQ/ΔL).7 Here, additional productivity is extracted with additional labour input with all other variables fixed. Eventually, however, additional labour input is not accompanied by greater product output and a saturation point is reached.
The physician care resources required are most commonly predicted by the number of patients evaluated. A single emergency department (ED) physician staffing model can be used for less than 17 500 patients, physician and midlevel for 17 500–25 000 patients and multiple physician model for more than 25 000 annual visits as an approximation.
There are numerous factors affecting ED provider efficiency, exclusive of the physician level of expertise, proficiency and work ethic. The two most obvious factors are the number of patients presenting for care, accompanied by their acuity, often with the admission rate used as a de-facto endpoint. The next area of concern offered by physicians is the impact of the amount of laboratory and radiology turnaround time. Another area of focus is the adequacy and effectiveness of nursing and ancillary staffing.
Finally, and at times reluctantly, physicians must critique their own work habits and productivity in terms of maximum efficiency—the emergency medicine ‘sweet spot’. This optimal efficiency is driven by adequate training and work experience, generating an effective diagnostic and testing process. This longitudinal derivation is acknowledged by most practitioners to be associated with confidence and decisiveness in making critical decisions without undue perseverance.
There is probably less focus on the day-to-day effectiveness; however, there is a declining work product associated, as well, with excess work stress related to overwork. The ED physician's well-honed skill set can become overextended with increased work hours, excessive shift rotation and work or personal distractions.
The goals of the investigation were to ask what is the most optimal physician workload associated with maximum efficiency in the ED setting. Secondarily, is this efficiency modified by facility or volume? Finally, what are the potential staffing and economic effects of this decision-making?
Methods
Study design
The ED practitioner efficiency study was a retrospective evaluation of all ED visits evaluated and billed over a 2-year period (2005–6) by a consortium of emergency medicine providers. Individual ED physician efficiency data points were correlated with individual work experience, annual workload, and profiled on facility size.
Methods of measurement, data collection and processing
Provider efficiency is defined as patients per hour (PPH), evaluated contingent on the time required to be seen by the provider. The resource-based value scale (RBRVS) based on the Harvard University study published by Hsiao and colleagues8 9 factored the procedural worth and geographical location to determine a monetary value of the intervention. The currency of this template is the resource-based relative value unit (RVU) factoring physician work, practice costs and malpractice expense.
Setting
This patient care information was abstracted from the Apollo Information Services, Inc. (Fort Myers, Florida, USA) database that has analysed over 10 000 000 patient ED encounters since 1998. This patient evaluation information was merged with a payroll information database, Lawson Software (Minneapolis, Minnesota, USA).
Selection of participants
We abstracted a convenience sample of efficiency in which data were recorded as a RVU (measured per hour) compared with total hours worked during the calendar years 2005 and 2006. Further analysis was predetermined to include the effect of hospital size measured as average ED volume in small (less than 15 000 visits), medium (15 001–30 000 visits), moderate (30 001–45 000 visits) and large (more than 45 001 annual facility visits) (table 1).
ED physician provider environments
Protocol
This study was exempted from the investigational review board requirement, reporting only unassigned medical billing analysis. No protected patient medical information was revealed, and no study interventions that directly affected patient care were utilised.
Primary data analysis
Data were collected and recorded in a Microsoft Excel (Redmond, Washington, USA) database and further analysed by G* Power 2 Statistical package (Dusseldorf, Germany) for power and calculations with SPSS for Windows 15.0 for analysis of variance (ANOVA) statistical comparisons. Efficiency data were represented graphically with annual hours worked on the x-axis and productivity measures on the y-axis. These data were represented as a best-fit trend line utilising a sixth order polynomial equation reported as a regression calculation (p<0.05). Differences between the groups were analysed using ANOVA (p<0.05) statistical comparisons of multiple groups.
Outcome measures
The primary endpoint was work product defined as PPH or RVU modified by hours worked as mean and SD. The secondary endpoints were determined per-experimentally to include facility efficiency defined by patient volume as modifiers, including PPH, RVU/h and RUV/visit.
Power/sample size
This study was judged to be adequately powered to detect differences between groups if a 99% CI with a 5% margin of error (α) and response distribution of 50% for moderate effects was achieved by analysing the sample size chosen from the universe of possible subjects.
Results
Characteristics of study subjects
Data were reported on 915 physician healthcare providers, with three eliminated due to incomplete data over a 2-year period from 2005 and 2006. They evaluated 2 404 833 patients in 61 different hospital ED utilising 1 352 285 clinical hours of coverage total generating 6 325 298 RVU of patient care activity (table 2).
Data summary of patient visits versus hours worked subdivided by practice site size
The majority of 912 practitioners provided care at medium (35.6%), moderate (29.3%) and larger (19.4%) sites, whereas smaller facilities (15.7%) were in the minority.
Main results
Our power calculations reveal that for our overall provider analysis with six predictors, including all polynomial effects, a sample size of 915, and an α level of 0.001, the multiple regression analysis had a power of 0.999 to detect moderate effects. Likewise, the provider facility based ANOVA calculation with four categories found a power of 0.999 to detect moderate effects. Volume accounted for 10% of the variance in efficiency measures for both comparisons.
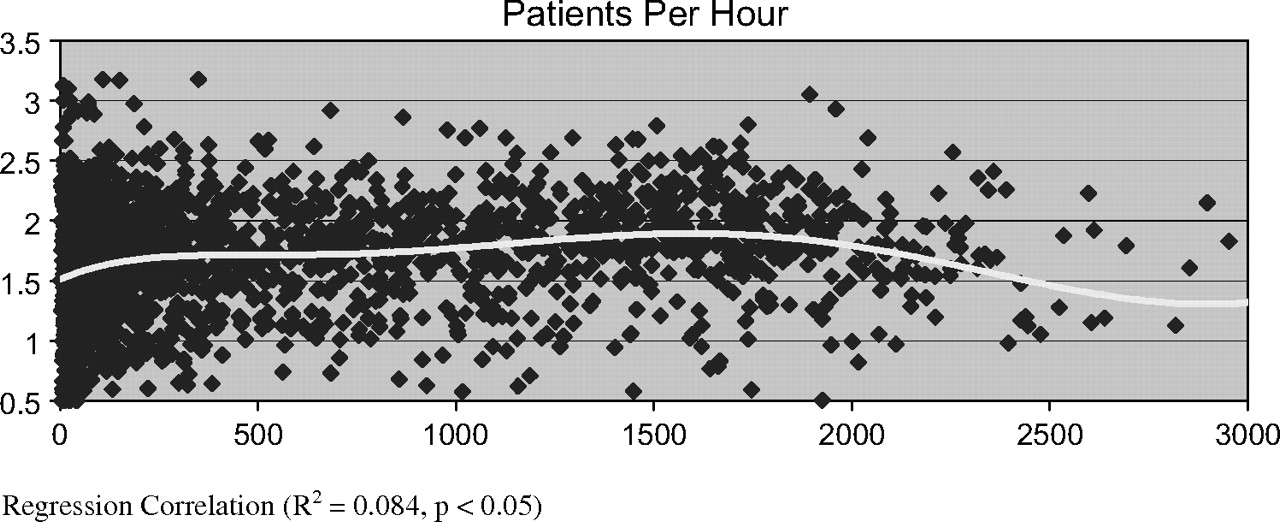
Overall staffing efficiency was 1.72±0.44 (PPH) increasing proportionally with patient volume with a range of 1.22±0.30 PPH at the smaller facilities compared with 2.1 PPH at the larger facilities (p<0.001) (figure 1). The RVU/h followed a similar decreasing with facility size trend, with an average of 4.43±1.21, ranging from 2.95±0.80 at smaller facilities to 5.43±0.83 RVU/h at the largest sites (p<0.001) (table 2). The individual physician productivity had less variation, with an average of 2.59±0.36 RVU/visit with a range of 2.42±0.21 for the smallest and 2.72±0.37 RVU/visit at the moderate-sized sites (p<0.001).

Overall physician productivity measured as patients per hour compared with annual workload. Regression correlation (R2=0.084, p<0.05).
The temporal trend in physician productivity finds a steep learning curve for casual practitioners (figure 2). Our best-fit trend line finds that practitioners working casually, less 250 h annually at the same site, are least productive, generating 4.0 RVU/h (R2=0.084, p<0.05). Productivity increases at a constant rate and at 500 h of average annual clinical activity generates 4.4 RVU/h. Maximal efficiency is reached in the 1250–1800 annual hour range, with 5.0 RVU/h generated. Interestingly, there was a point of maximal return at approximately 1550 h annually, with a significant decline noted after 2000 h, and even further after 2500 h worked annually.
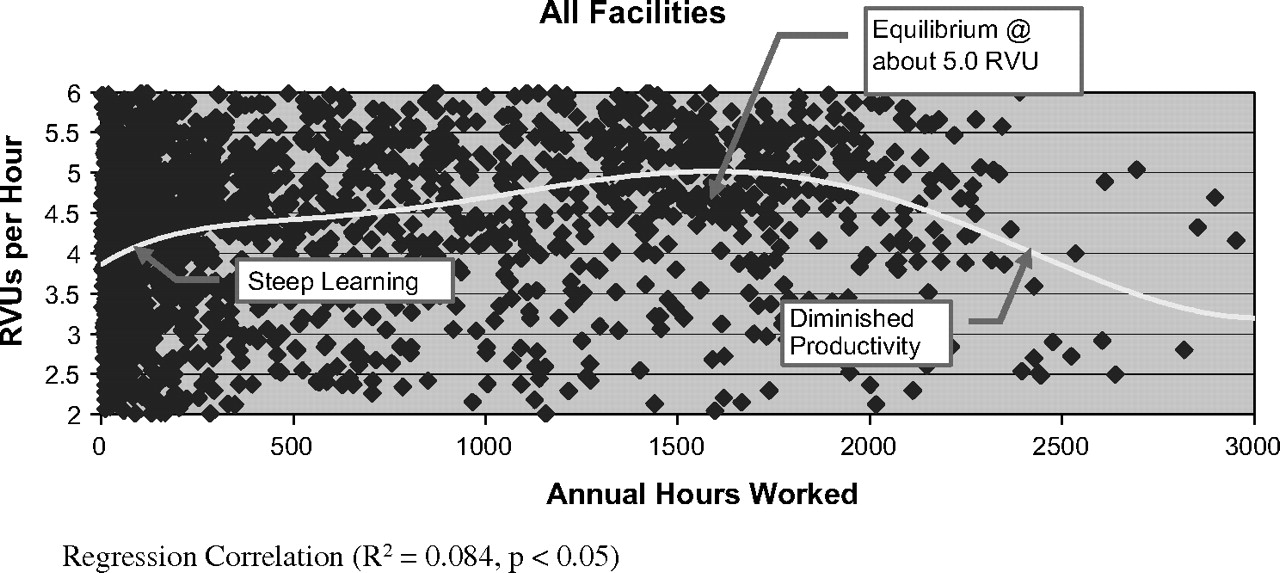
Overall physician productivity measured as relative value unit (RVU) per hour compared with annual workload. Regression correlation (R2=0.084, p<0.05).
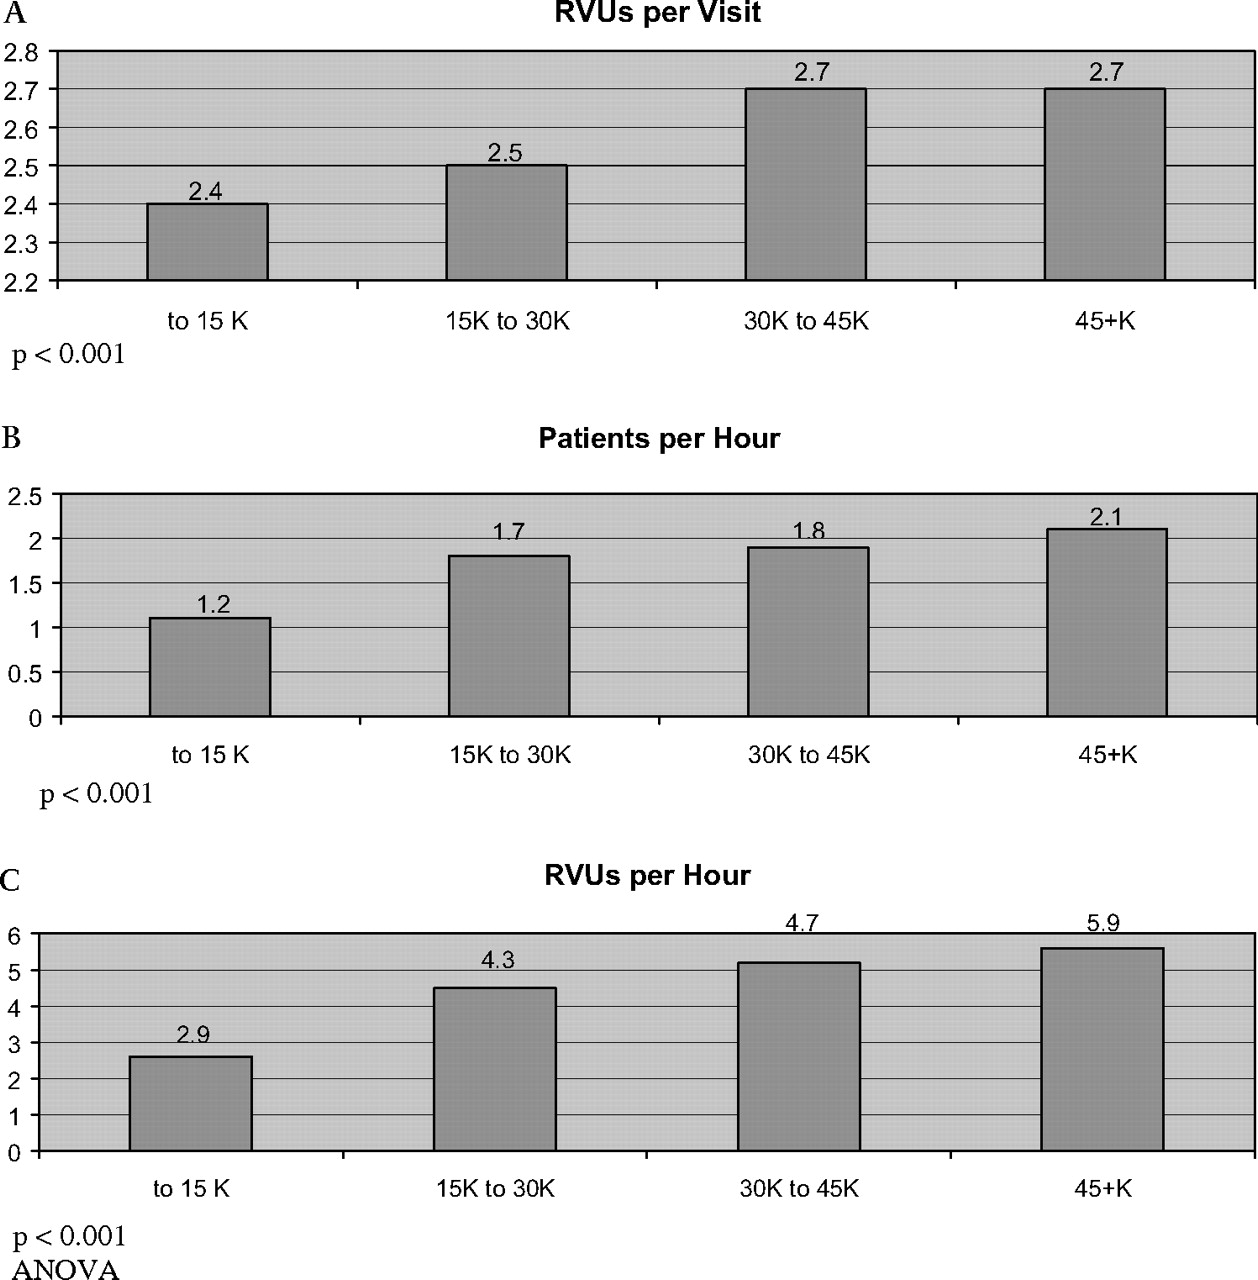
There was similar trending noted based on the size of the facility. Higher ED patient volume equated with better efficiency with 2.4–2.5 RVU generated per visit in small (15 K) to medium (20 K) sized facilities increasing to 2.6–2.7 RVU/visit in larger (30–45 K) facilities (p<0.001) (figure 3A).

Physician productivity based on emergency department volume. (A) Relative value unit (RVU) per visit. p<0.001; (B) Patients per hour. p<0.001; (C) RVU/h. p<0.001, analysis of variance (ANOVA).
Factoring in the increased number of patients evaluated at larger (1.7–2.1 PPH) versus smaller facilities (1.2–1.7 PPH) finds a progressive increase in RVU generated per hour from 2.9 in small, 4.3 in medium, 4.7 in moderate and 5.4 in large facilities (p<0.001) (figure 3B, C).
The equilibration point was 2.7 RVU generated per hour consistently until a decline was again noted when at least 2000 h were worked annually. The smallest facility seemed to have less variation with 1.0 PPH and 2.8 RVU/h productivity maintained through the span of work activity (figure 3B,C).
Discussion
There are a vast number of recommended ED staffing approaches. Historically, the average number of patient encounters in the ED is 2.0 (1.8–2.2) PPH evaluated.10 As systems have matured or simply become more stressed, the mean number of patient encounters has increased to 2.25 (2.0–2.5) on average.
Another primary endpoint finds the RVU productivity model with its origins in the 1992 Medicare change in renumeration for projected costs and not charges based on the RBRVS service provision.11 The cost is calculated by physician work (52%), practice expense (44%) and professional liability insurance (4%) multiplied by a conversion factor and geographical case modifier. The major factor in this analysis is the physician work component. The RVU is based on the original Harvard University study.8 9 The RVU includes: (1) time to perform service; (2) technical skill; (3) physical effort; (4) required mental effort and (5) judgement and stress due to potential patient risk, and is revaluated by the Center for Medicare and Medicaid Services every 5 years.
In summary, the RBRVS assigns a relative value to a procedure performed by a provider adjusted to a local cost of a geographical region, multiplied by a fixed conversion factor to determine the overall healthcare cost.
Analysis of our secondary endpoint is comparable to a previous work. There is an interesting non-linear distribution of workforce compared with annual visits. Small facilities (less than 20 000 visits) are routinely associated with efficiencies of 1.96 PPH, modest (20–30 K) of 2.05 PPH, moderate (30–40 K) of 2.41 PPH and large (40–50 K) facilities of 2.06 PPH.12 The maximal efficiency was found in the moderately sized facility, with lesser efficiency in the small followed by the largest facilities.
Although the more common measure of ED physician productivity is PPH evaluated, we feel that the RVU/h measure better evaluated the complexity of the ED patient and allowed us to define the ‘learning curve’ and marginal productivity concepts relating to these data. Our staffing and productivity benchmarks were 1.78 (1.1–2.1) PPH and 4.48 (2.6–5.6) RVU/h, with efficiency increasing proportionally with patient volume evaluated.
Our primary and secondary endpoints were more than adequately powered to state our conclusions concerning overall provider efficiency within the predicted limits of our polynomial plotting methodology, as well as that categorised by facility size ANOVA analysis.
There were three distinct zones of productivity defined by our best-fit trend line for the ED population (table 3). The resulting correlation was significant but of modest effect, with 10% of the variance due to the studied variable. First, there was a zone of increasing productivity or the ‘learning curve’ in which RVU/h increased rapidly at first then at a more moderate rate. Second, the equilibration phase in which RVU/h were constant is when the emergency medicine efficiency ‘sweet spot’ was reached. Here, the learning curve has plateaued to a point of maximal efficiency. This phase optimises ‘parallel process thinking’ rather than ‘serial patient management’; the physician simultaneously, rather than sequentially, handles the multitude of tasks required to manage emergency patients optimally. Third, there is a phase of diminished productivity in which the RVU produced per hour are decreasing. This phase can be best described as one potential manifestation of the physician ‘burnout’ phenomenon.
ED physician productivity
It is crucial to recognise that the learning curve can exist even in an experienced provider in a new facility, as unfamiliar procedures and processes are encountered. The corollary suggests that a disproportionate number of part-time compared with full-time physicians can have an adverse impact on departmental efficiency. This trend may also be accentuated with locum tenens physicians who may not be adept at regional care practices and standards. Likewise, the use of a significant number of ‘new’, less experienced providers may require staffing accommodations until all practitioners are ‘up to speed’. Finally, stable, experienced full-time physicians may become complacent and limit their workload autonomously.
Remember that trend group data do not predict individual performance, especially relevant to the loss of productivity trend. Some of the best physicians include part-time or locum tenens physicians who may take maximum productivity even when exceeding the average full-time equivalent (FTE) (1800 h annually) work component. However, productivity, customer service markers such as patient complaints, and malpractice exposure should be monitored on the FTE-plus working cohort.
Likewise, the most valid measure of productivity is RVU/h, although most staffing models are geared to PPH templates. Here, the conversion factor from Medicare in 2007 finds each RVU worth US$37.00. Therefore, the financial benefits of an average (4.4 RVU/h) compared with optimal (5.0 RVU/h) provider translates the US$22.00 per hour difference (0.6 RVU×US$37.00). This trend forms the basis for most ED incentive payment programmes.
Finally, group efficiency can be commented upon based on facility size data. This was a trend noted to improve productivity measured as RVU generated per hour with almost a twofold increase from small (2.9 RVU/h) to large (5.4 RVU/h) facilities. The reasons for this effect are speculative and may include the fact that large facilities have: (1) a more complex patient mix; (2) better practitioners; (3) better nursing care; (4) better service integration; (5) augmented programmes and (6) better auxiliary services such as laboratory or x-ray.
Likewise, those that work in smaller facilities would suggest that their labour is more intense. They suggest that the individual assumption of duties more likely to be shared by specialists, consultants and other providers in the larger centres may also hinder them. Probably the most likely effect, however, is the limitation of the number of patients presenting. The smaller facilities are restricted in their baseline staffing and are often left to care for the patients who present, sometimes beneath their actual capacity, which is the most likely cause for the decrease in this ratio.
Interestingly, productivity seemed more stable in the smaller facilities. Their practitioners would stress self-reliance and their responsibility to maintain a steady flow in these solo staffed locations. There is an inability to shift work responsibilities to other practitioners, either ED physician colleagues or hospital consultants with patient overload.
Proper planning approaches included factoring for new or inexperienced practitioners, veteran burnout and facility vagaries to ensure safe staffing and patient safety.
Limitations
We acknowledge wide variation in practice dictated by both positive and negative efficiency influences. Improvements noted include better training, technology information systems and performance incentive plans driving provider efficiency. Detriments include adverse payor mix, adverse medical–legal environment, admission delays, facility overcrowding issues and suboptimal support staff.
The most commonly encountered dilemma is the non-uniform distribution of patients, with daytime activity associated with a 25–50% increase in patient flow, whereas at night a 25–50% decrease quantitatively at the same sites is often found. It is recognised, however, that this night time activity is complicated by an increase in patient complexity, increased psychosocial burden and lack of resources and programmes available.
The impact statements derived from this work were focused on the balance between quality and quantity to achieve maximal efficiency and effectiveness factoring in trends such as experience, the workload at hand and facility size. The important considerations include: first, the ‘learning curve’ for new or unfamiliar providers; second, the marginal productivity model in which efficiency is maximised below the acceptable FTE work equivalent; and third, the potential productivity trade-off based on facility size. Finally, we recognise the limits of group trending on the prediction of individual performance.
Footnotes
Competing interests None.
Provenance and peer review Not commissioned; externally peer reviewed.
Linked Articles
- Primary survey