Article Text

Abstract
Objective To benchmark walk-in presentations to emergency departments (ED) with those presenting to other local acute healthcare facilities.
Setting A large teaching hospital with an annual ED census of 140 000 adult patients and surrounding associated acute healthcare providers.
Methods A random sample of 384 patients who self-presented to the ED was obtained. Benchmarking data were drawn from two general practices; the Tower Hamlets Community Services walk-in centre (co-located on-site with the ED) and the GP-run out-of-hours service.
Results The case-mix presenting to the ED was characterised by a higher proportion of injuries and chest pain, but fewer simple infections and non-traumatic musculoskeletal conditions as compared to other acute care facilities in our region.
Conclusions Patients with injuries and possible cardiac chest pain were more likely to attend the ED, and those with infection or musculoskeletal problems less likely, as compared with other acute healthcare facilities. The population presenting to the ED is distinct from that presenting to general practice, out-of-hours clinics, or walk-in centres.
- effieciency
- emergency care systems, primary care
- emergency care systems, admission avoidance
- clinical assessment, effectiveness
- comparitive system research
Statistics from Altmetric.com
- effieciency
- emergency care systems, primary care
- emergency care systems, admission avoidance
- clinical assessment, effectiveness
- comparitive system research
Introduction
Emergency departments (ED) see and treat a wide range of conditions, from critical illness to the worried well. Overcrowding of EDs is commonly described and has been linked to poor outcomes and increased mortality.1 ,2 Despite various strategies to reduce ED attendance, in many areas numbers are increasing in excess of population growth.3 ,4 In 2010–2011, there were just over 16 million attendances at EDs in England, with 21.9% admitted to hospital, as compared with 12.3 million in 2007–2008, with 21% admitted.5 ,6 London has one of the highest rates of ED attendance in the UK. Around 76% of all attendees are ‘walk in’, with 84% of these and around half of those arriving by ambulance being discharged;7 22% of all attendances are completed within 1 h and 50% within 2 h.7
There is on-going debate concerning the proportion of patients presenting to ED who are potentially suitable for care in general practice, with figures between 4.8% and 90% identified.8–,11 This wide variation suggests that defining the true burden of general practice patients attending ED is difficult, with no widely accepted criteria. This lack of data hampers efforts to reduce ED attendance and to truly define the scale of the problem.12 In 1990, Dale et al studied attendances between 1000h and 2100h at a large urban ED. Triage assessment classified 40.9% as primary care. However, 9.7% of this group were referred to on-call teams and 8.9% to fracture clinic. The groupings of patients into primary care or ED-suitable patients were by triage nurses and did not follow strict physiological, anatomical or pathophysiological criteria.13 A similar study performed in the same region as our study similarly used the Sheffield process-based definition of a primary care attendance and identified 43% of attendances as suitable for primary care, with 14.1% of self-referred patients being admitted and 10.2% being referred to outpatient clinics.14 Whether patients are best cared for in the ED or general practice is likely to change with service availability, patient wishes and advances in diagnostic and therapeutic technology.
At our large urban teaching hospital (census 140 000, 28 000 paediatric), we introduced a two-tier streaming system designed to facilitate early assessment, investigation and referral of all attending patients. Streaming operated between 0800h and 2200h. Streaming 1 operated for walk-in patients, and streaming 2 for patients arriving by ambulance.
Adult patients who self-presented to our ED initially booked in at reception and were then assessed by a GP, senior nurse or emergency physician (EP) at streaming 1. Assessment took place in dedicated cubicles and there was a separate cubicle with a bench to allow examination if required. Assessors were provided with minimal equipment—auroscopes, opthalmoscopes, tongue depressors and automated pulse/blood pressure/oxygen saturation monitors. The patients could be discharged from streaming 1 or referred for further assessment as outlined in figure 1.
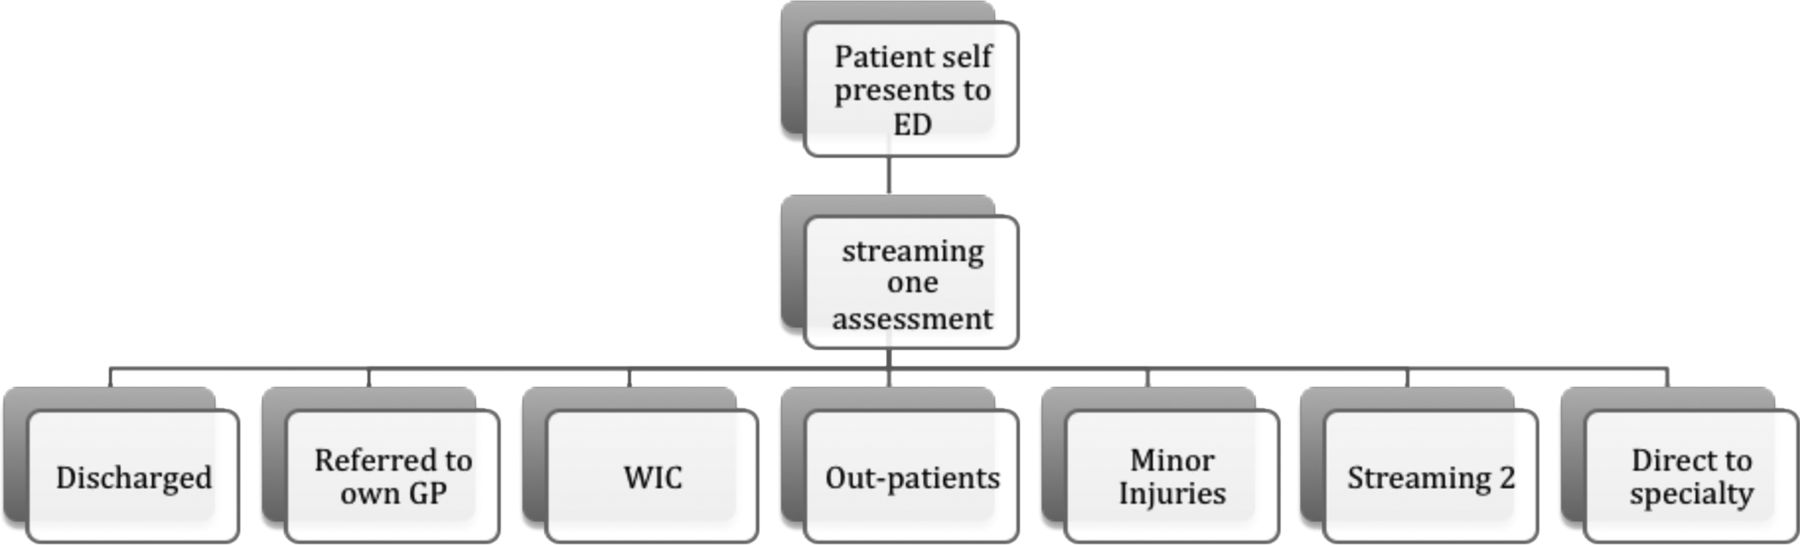
Patient disposal from streaming 1; walk-in centre=on-site nurse and GP-staffed walk-in centre; OP=outpatient services at hospital; Streaming 2=area for initial assessment of all majors patients in emergency departments (ED).
In streaming 2, patients received a focussed history and examination, baseline physiological observations, an ECG, initial blood tests and any urgent radiological investigations required were requested.
The patients self-presenting to our institution were, therefore, simply identified. We set out to compare this population to that presenting to other acute-care facilities in our region. To obtain this benchmark data we also undertook an audit of attendance data and diagnostic codes at two local GP surgeries (urgent same day appointments), the walk-in centre (WIC) located adjacent to the ED and the GP out-of-hours service (OOH). The WIC did not have access to imaging or blood-based investigations.
Methods
We randomly prospectively identified 4 h blocks of streaming 1 activity (using random number generation). We collected the patients’ hospital numbers and then obtained the patient record for the attendance. A GP and an EP (KM and TH) reviewed each patient record. We scrutinised the notes for patient demographics, case-mix and diagnosis. Data were stored on a password protected Microsoft excel database, which were then interrogated to provide the results. The range of clinical presentations are defined in the box.
Definitions used to classify reason for attendance at streaming 1, out-of-hours, walk-in centre and GP
-
Injuries—Soft tissue and musculoskeletal trauma; minor head injury; alleged assault.
-
Gynaecology—All gynaecological presentations, first 20 weeks of pregnancy and non-pregnant.
-
Infection—All viral, bacterial and fungal infectious disease, except exacerbations of COPD/asthma and acute abdominal pain with surgical signs (eg, appendicitis, diverticulitis).
-
Respiratory—Acute asthma and exacerbations of COPD.
-
Musculoskeletal—All musculoskeletal and joint problems, excluding trauma.
-
Abdominal—All abdominal pain, excluding urosepsis, likely infectious diarrhoea and gynaecological presentations. For infection control infectious diarrhoea bypassed streaming to be assessed in an isolation cubical.
-
Cardiac—Any chest pain that met criteria for emergency departments (ED) protocol rapid assessment chest pain pathway to diagnose or exclude ischaemic heart disease, and congestive cardiac failure (1 patient).
-
Psych—All psychiatric presentations, including all deliberate self-harm, depression and psychosis. but excluding panic attacks (as these are treated by ED staff with no psychiatric input).
-
Other—Illness not categorised in the above.
-
Unknown—Diagnosis not clear from the patient record (this group were discharged from streaming 1 without firm documentation of a diagnosis).
Benchmarking data
In order to obtain benchmarking from acute presentations at neighbouring general practices, two local GPs (who also work in the ED) recorded diagnoses and demographic details from patients attending their practices for urgent same day appointments. The GP data was collected from sequential attendances at ‘emergency appointments’ booked by patients themselves on the day. The two practices operate in the same manner, with similar triage and booking systems. They serve different areas, with one situated in a business/residential area and the other in a residential area with a higher proportion of social and budget housing.
The WIC was nurse-led and staffed with 2–4 nurses and 1 GP depending on the time of day. It was open from 07:00 to 22:00 and was a walk-in-only service. The GP OOH service was a locally based service covering Tower Hamlets GPs only. It was a telephone triage service; with around 60% of calls completed by telephone, 30% invited to the centre for a consultation, and around 10% offered a home visit. Data from the OOH represent a screened population who may be referred by phone directly to the ED, and as such are not truly comparative data for initial presentations. Similarly, no attempt was made to follow-up patients who received telephone advice alone to see if they subsequently attended the ED. The WIC and OOH data was collected from the computerised ADASTRA database by KM. These notes were not individually scrutinised for accuracy of coding or appropriateness of treatment. The diagnostic codes were grouped into the same categories as those for ED. The aim of this was to be able to compare the presenting conditions at a variety of urgent care settings in our region.
Audit data suggests that the GP urgent appointments are associated with a referral to hospital rate of around 1%. From our data, the referral to hospital rate from the OOH was 13.6%, and from WIC services was 7.6%.
Results
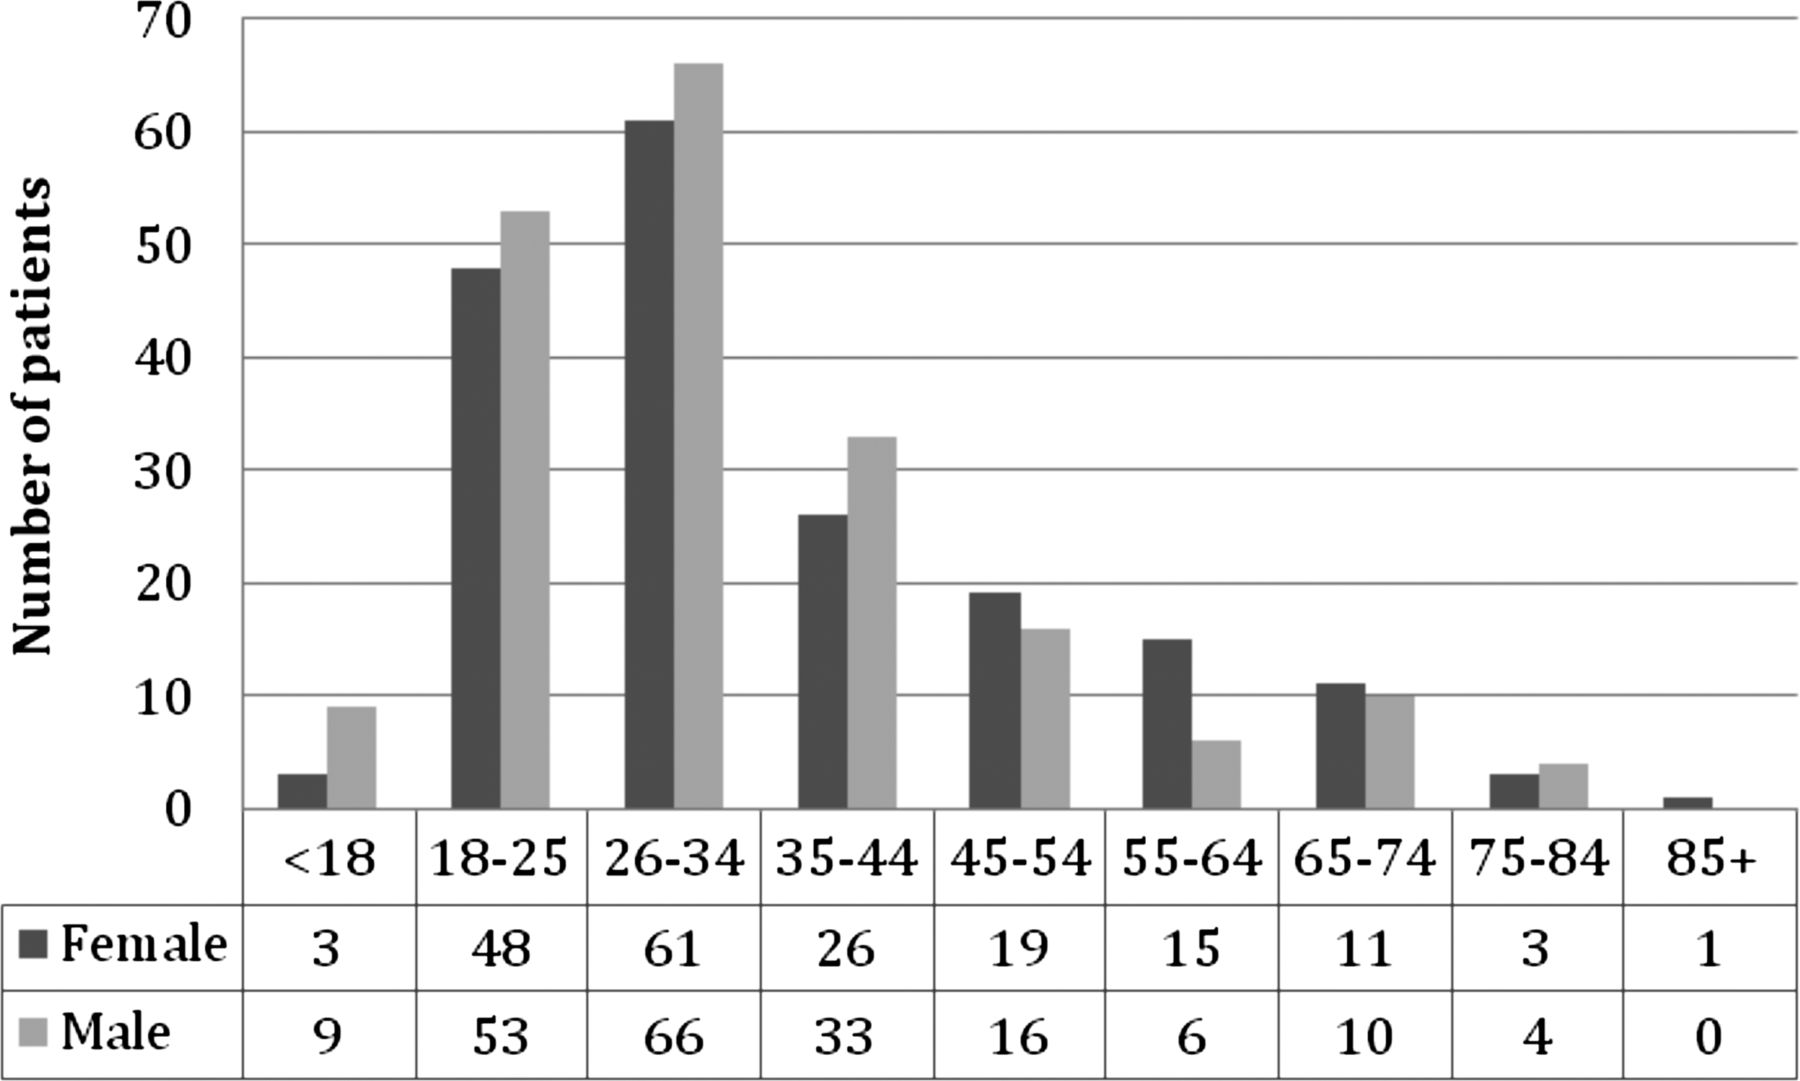
Totally, 384 ED patient records were audited for streaming 1 attendance; 51% of all presentations were male and 60% were 18–34 years old. The most common ethnic backgrounds were: 26% White British, 24% Asian British, 9% Black British, and 9% White/other White, 7% Asian and 7% any other. Overall, 85% of patients were discharged from the hospital; 7% were admitted to in-patient care, and 2% to the clinical decisions unit (CDU) (22% discharged the same day, 48% discharged the following day, time not recorded 26%). Data were not available for 6%.
Patient demographics for the 4 sites (ED streaming 1, WIC, OOH and GP) are presented in figure 2 and table 1.
Age ranges for patients presenting to ED streaming, OOH, two general practices and WIC
Age and sex of patients attending emergency departments streaming 1.
Statistical analysis for patient demographics at the 4 sites
Different ages were compared using an analysis of variance, and the individual groups compared adjusting for multiple comparisons using Scheffe’s adjustment. Differences in proportions of males were examined using a χ2d test, and on finding a difference the proportions in the individual facilities were compared. There were significant differences in age (p<0.001) and sex (p<0.001) in the patients presenting at the 4 sites. Specifically, patients presenting to OOH and GP were significantly older than those presenting to ED and WIC (p<0.001). More males presented to WIC and ED than OOH (p<0.001).
The ranges of clinical presentations by the presenting site, are presented in table 2.
Case-mix for presentations to streaming 1, GP urgent same day appointments, OOH service and WIC, by percentage (rounded to whole figures) and absolute numbers, with Odds of ED as compared with non-ED presentation by case mix
The categories for each disease group are defined in the box.
Details on the categories for infection and ‘other’ are as follows:
-
Infection—all viral, bacterial and fungal infectious disease, except exacerbations of COPD/asthma and acute abdominal pain with surgical signs (eg, appendicitis, diverticulitis). The most common categories were—cellulitis/abscess/paronychia—41%, upper/lower respiratory tract infections/(without wheeze or chronic lung disease), flu-like illnesses account for 36%, urosepsis 11%, pneumonia 3%, sexually transmitted disease 3%.
-
Other—Illness not categorised in the above—includes headache, gastrointestinal bleed, foreign body (FB) in ear, FB in throat, epistaxis, requesting HIV prophylaxis, dental problems, missed out-patients, requests for second opinion of on-going illness or review of on-going health concern (eg, hypertension, fracture review), request for blood tests, request for investigation for non-acute problem (weight loss, insomnia), postoperative problem, request for results of tests, deep vein thrombosis, rash or skin lesion, burn, renal colic, biliary colic, vertigo, isolated haemoptysis, syncope, allergic reaction, palpitations, panic attack, run out of medication, testicular pain or swelling, peripheral vascular disease, TIA, aphthous ulceration, health anxiety and dressing changes.
Statistical analysis for the case mix at the 4 sites
The case-mix in the non-ED facilities (GP, OOH, WIC) was compared using a multinomial logistic regression. Overall, there was a significant difference between the facilities (χ2 with 16 DF=42.85). However, the only significant difference among the case-mix was for respiratory illness, which was significantly lower for OOH and WIC than for GP (see table 1). The data were therefore combined for the three non-ED facilities, and the odds of going to the ED compared to a non-ED facility, according with case-mix compared with the abdominal category, was investigated by fitting a logistic regression.
Discussion
Our hospital serves a young, poor inner city population with a high proportion of patients born outside the UK. Significant proportions of our attendees work within the hospital catchment region and commute from some distance away. Thus, should this latter group become ill at work then care is frequently sought in the study hospital and not the hospital that this client would usually attend. This is reflected in the young age of attendees, with 60% of all attendees aged between 18 and 34 years. Overall, 85% of all walk-in patients in this cohort were streamed out of the ED, which is similar to the figures for London overall (84%).9 Nine per cent of patients were admitted to hospital for over 12 h; 7% were admitted to inpatient units and 2% to the CDU under ED care. Three patients (0.78%) were moved directly from streaming to resuscitation (one with ST elevation myocardial infarction subsequently referred for angioplasty, one with chest pain highly suggestive of coronary ischaemia, but normal ECG and troponin, and one with stroke not meeting criteria for thrombolysis).
How did the patient demographics compare between acute care providers?
The patient demographics differed between the locations providing acute care by age and sex, with a younger population and more males being cared for in ED and WIC as compared with GP and OOH (box). The mean age of attendees across all the study sites was 38.1 years. Data from the NHS Information Centre found that women had higher GP consultation rates than men, except at the extremes of ages. In the age group of 20–40 years, GP consultation rates for women were approximately double those of men.15 Access to the OOH service requires GP registration with a Tower Hamlets GP, or to be resident in Tower Hamlets. The WIC typically sees a high proportion of unregistered patients, visitors and new arrivals to the area. This tends to be a young population. Additionally, it is known that young men are less likely to register with GPs.15 Previous similar studies have also identified younger patients as more likely to use the ED as opposed to their GPs for health issues that could be cared for in primary care.13 ,14
How did the Case-mix compare between acute care providers?
The case-mix for patients attending streaming 1 is shown in comparative data for all sites in table 1.
We found a similar case-mix of presentations to the WIC, OOH and GP sites, with the only difference being for respiratory illness presentations. These were less common to OOH and WIC as compared with GP. There were no further differences in case-mix between OOH, WIC and GP. Combining all non-ED presentations, we found that patients with injuries were 12 times (95% CIs 7 to 19) more likely to present to ED as compared to non-ED sites, as compared with abdominal pain. Abdominal pain was chosen as a baseline for comparison, as the group is large with no significant differences between the sites. Patients were also 4 times (95% CIs 1.83 to 9.65) more likely to present to ED with chest pain suggestive of myocardial ischaemia as compared with non-ED sites. Patients were 0.23 times (95% CIs 0.13 to 0.41) as likely to present to ED with infection, and 0.48 times as likely (95% CIs 0.26 to 0.89) with muscluloskeletal problems.
These data suggest that patients are actively identifying different pathologies to attend different acute-care locations, choosing ED for injuries and chest pain, and non-ED sites for acute infections and non-traumatic musculoskeletal presentations. Patients may choose the ED for these conditions as they believe this team has greater expertise as compared with their GP, that they require radiographs or other investigations not available to their GP, or that the perceived severity of pain or injury warrants immediate attention. The increased attendance with chest pain suggestive of myocardial ischaemic may also reflect perceived urgency, or be in response to the recent healthcare advertisements that highlighted the symptoms of acute myocardial ischaemia.
Recent London data examining all primary care presentations suggest that infection of the respiratory tract is the most common urgent presentation to general practice.16 This study also identified dermatological conditions as the second most common GP presentation, while the second most common presentation to ED was for gastrointestinal problems, both a much rarer group in our study. As in our study, injuries were the most common presentation to ED but were not in the top 10 categories for general practice. The lack of a standardised method of recording attendance data hampers comparisons.
There have been a variety of strategies aimed at reducing the number of unplanned admissions to hospital. A recent review examining 13 interventions using data from 274 separate studies concluded that only a few techniques targeting specific groups were effective in reducing unplanned admissions.17 Those found not to be successful included specialist clinics, community interventions, medications review, ED interventions, continuity of care and hospital at home. The number of ED attendances continues to rise, suggesting the public choose ED attendance over other healthcare access points for at least some of their healthcare.3–,6 Since most EDs are not sufficiently staffed to cater for the increasing attendances exploring alternative staffing and healthcare delivery models within the ED is vital.
Limitations of study
The study is based on a small proportion of the attendees at each of our study institutions. Thus, this work can only be viewed as pilot data, and a much larger study should be undertaken over a much larger number of hospitals and associated institutions. The number of medical conditions is large and the absolute numbers of each is small, so many diagnoses were analysed together in the groups defined above. This study is based on data for a highly diverse population, both in terms of socioeconomic and ethnic backgrounds. Our patients are likely younger, from a lower socioeconomic class and more frequently born overseas as compared with most UK EDs. In working hours, a significant proportion of ED attendees are from out of the hospital's catchment area as they work near the hospital and live out of London. As such, it may not represent many other areas of the UK accurately and our data is not generalisable. The lack of data from other sites hampers any comparisons and we are not able to make any comment about the generalisability of our data to other hospitals.
The data collected from the WIC and OOH are based on coding entered on the ADASTRA computer system, which have a limited set of codes that may bias the diagnostic categories. Patients were not followed up and the diagnosis not substantiated, which potentially adds further error.
The paper does not make an attempt to fully assess the severity of illness within each disease category. Thus, abdominal pain could range from mild self-limiting illness such as non-specific abdominal pain, to life-threatening disease, such as a rapidly expanding abdominal aneurysm. The fact that, overall, around half the patients attending streaming 1 were referred into the ED for further assessment suggests that walk-in patients presenting to ED frequently require more detailed assessment, and this implies they are more complex than those attending the other healthcare facilities we studied.
We also had a high proportion of patients in whom the diagnosis was not clear from the notes. This is in keeping with past studies where many acute cases are classified as a symptom with no documented diagnosis.
Our data was obtained from random shifts and we did not collect data on the time of the presentation. This is clearly a factor that will affect patient attendances. However, we run streaming 0800h to 2200h, and the GP urgent clinics are run 0800h to 2200h, so the data presented does not include night-time attendances.
We also did not collect data on the acuity of the presenting complaint; for example, whether the pain was mild or severe. This is likely to alter patient selection of acute service attendance.
Summary
The walk-in population attending ED is different to those who present to general practice, the WIC and OOH, with a higher proportion of injuries and possible cardiac chest pain, but fewer musculoskeletal conditions and fewer infections. Around half the patients attending streaming 1 were directed into the ED for further evaluation, suggesting a complex cohort or higher risk findings on evaluation. This is a higher proportion than observed in general practice. These findings suggest that the population attending the ED has distinct differences from that attending general practice.
Acknowledgments
The authors would like to acknowledge the support of Ms Jane Baylis for commissioning the study, Ms Liz Price for tabulating the results, Ms Suzy Hannah for organising patient notes, and doctors Toby Longwill and David Whittington for arranging data collection in their general practices.
Footnotes
-
Contributors TH and KMcD conceived the study, reviewed all notes and collated data. Statistical analysis was obtained. The paper was written by Tim Harris and reviewed by KMcD.
-
Competing interests None.
-
Ethics approval The study was reviewed by the Chair of ethics committee two, East London and classified as audit. Ir was registered along local guidelines.
-
Provenance and peer review Not commissioned; externally peer reviewed.
-
Data sharing statement The data is published completely in two parts, both submitted to EMJ.