Article Text

Abstract
Background The most common route to a hospital bed in an emergency is via an Emergency Department (ED). Many recent initiatives and interventions have the objective of reducing the number of unnecessary emergency admissions. We aimed to assess whether ED admission thresholds had changed over time taking account of the casemix of patients arriving at ED.
Methods We conducted a retrospective cross-sectional analysis of more than 20 million attendances at 47 consultant-led EDs in England between April 2010 and March 2015. We used mixed-effects logistic regression to estimate the odds of a patient being admitted to hospital and the impact of a range of potential explanatory variables. Models were developed and validated for four attendance subgroups: ambulance-conveyed children, walk-in children, ambulance-conveyed adults and walk-in adults.
Results 23.8% of attendances were for children aged under 18 years, 49.7% were female and 30.0% were conveyed by ambulance. The number of ED attendances increased by 1.8% per annum between April 2010–March 2011 (year 1) and April 2014–March 2015 (year 5). The proportion of these attendances that were admitted to hospital changed negligiblybetween year 1 (27.0%) and year 5 (27.5%). However, after adjusting for patient and attendance characteristics, the odds of admission over the 5-year period had reduced by 15.2% (95% CI 13.4% to 17.0%) for ambulance-conveyed children, 22.6% (95% CI 21.7% to 23.5%) for walk-in children, 20.9% (95% CI 20.4% to 21.5%) for ambulance conveyed adults and 22.9% (95% CI 22.4% to 23.5%) for walk-in adults.
Conclusions The casemix-adjusted odds of admission via ED to NHS hospitals in England have decreased since April 2010. EDs are admitting a similar proportion of patients to hospital despite increases in the complexity and acuity of presenting patients. Without these threshold changes, the number of emergency admissions would have been 11.9% higher than was the case in year 5.
- emergency department utilisation
- emergency care systems
- admission avoidance
- hospitalisations
This is an Open Access article distributed in accordance with the Creative Commons Attribution Non Commercial (CC BY-NC 4.0) license, which permits others to distribute, remix, adapt, build upon this work non-commercially, and license their derivative works on different terms, provided the original work is properly cited and the use is non-commercial. See: http://creativecommons.org/licenses/by-nc/4.0/
Statistics from Altmetric.com
Key messages
What is already known on this subject?
The most common route to a hospital bed in an emergency is via an ED.
Many recent initiatives and interventions have the objective of reducing the number of unnecessary emergency admissions.
Several studies have identified patient and attendance characteristics that are associated with increased risk of admission.
What this study adds?
The casemix-adjusted odds of admission via ED to NHS hospitals in England have decreased since April 2010.
The number of attendances that have a low probability of admission has reduced since April 2010.
Introduction
Rising demand for emergency hospital admissions is a feature of many healthcare systems.1 There were 5.6 million emergency admissions to NHS hospitals in England during April 2014–March 2015, an increase of 27% over 10 years.2 These admissions account for almost 70% of hospital bed days. Some emergency admissions are preventable or could be avoided if alternatives were available, and as such represent an unwarranted cost for commissioners.3 4 Many recent NHS policy initiatives and commissioning interventions have been designed to avoid unnecessary emergency admissions.5–7 Clinical decision units in EDs, ambulatory care units and acute frailty units have expanded in recent years, with one aim being to reduce admissions. Since April 2010 hospital trusts have been paid at a marginal rate (30%) for emergency admissions above historical levels.8 This policy was introduced to ‘incentivise lower rates of emergency admissions’ and ‘stimulate acute providers to work with other parties in the local health economy to reduce the demand for emergency care’.8 Others have suggested that some emergency admissions may be supply-induced or associated with ED performance targets.9 10
The most common route to a hospital bed in an emergency is via an ED.2 Admissions via ED represent an increasing proportion of all emergency admissions.11 Approximately one-fifth of patients attending EDs in English NHS hospitals are admitted to a hospital bed.12 English NHS hospitals are expected to triage, treat and discharge or admit patients attending ED within 4 hours.13 The standard was originally set at 98% of patients but was lowered in 2010 to 95% to allow greater time for complex investigations.14 Performance against this standard has been deteriorating since 2010 and has fallen below 95% since 2013.15
Previous studies have identified a range of casemix variables (eg, age, presenting condition, arrival mode) and attendance characteristics (eg, time of year, day of week) that are associated with an increased risk of admission for a patient in ED.16–20 We use a routine English administrative data set to assess changes in the casemix-adjusted odds of admission via ED between April 2010–March 2011 (year 1) and April 2014–March 2015 (year 5) to provide insight into whether ED admission thresholds have changed and the impact of admission avoidance policies and interventions.
Methods
Study design, setting and population
We conducted a retrospective cross-sectional analysis of 20 224 711 attendances at 47 consultant-led EDs in England between April 2010 and March 2015. Given the importance of diagnosis as a casemix variable, the NHS organisations included in the study were those where at least 70% of ED attendances had a valid primary diagnosis code and at least 95% had a valid disposal code within each year of the study period. Follow-up attendances were excluded along with attendances for patients who were dead on arrival, who died in the department or who left the department having refused treatment or before being treated.
Variables and data sources
An anonymised extract of the Accident and Emergency Hospital Episode Statistics (HESAE) was obtained from the NHS Health and Social Care Information Centre for the 5-year period from April 2010 to March 2015.
The outcome variable was defined with reference to the disposal code in HESAE, taking a value of 1 when the patient was admitted to a hospital bed with the same healthcare provider and a value of 0 in all other circumstances (eg, discharge, referral or transfer to another service). Admissions may include short-stay admissions to assessment units outside of the ED.
Potential explanatory variables were identified with reference to previous studies and included patient characteristics (age, gender, ethnicity, deprivation, primary diagnosis, prior ED attendances and admissions), arrival year, time of year, part of week and time of day of arrival, arrival mode (by ambulance or other means) and the ED of attendance.16–20
A patient’s age, gender, ethnicity and primary diagnosis, and the date, time and ED of the attendance, are routinely recorded in HESAE.12 Patient ethnicities were assembled into six groups: white, Asian/Asian British, black/black British, mixed parentage, other ethnic groups and not known/not stated. Socioeconomic status was measured using the 2004 Index of Multiple Deprivation (IMD) rank assigned to the lower super output area in which the patient lived.21 IMD ranks were grouped into quintiles. A patient’s prior A&E activity was assigned to three levels: none, attended ED at least once but not admitted via ED, and attended and admitted at least once. Prior A&E activity levels were assigned for two time periods: the 28 days before attendance and between 29 and 365 days before attendance. The 39 two-digit primary A&E diagnosis classification codes in HESAE were used to define the patient’s diagnosis. Arrival year (1=April 2010–March 2011; 2=April 2011–March 2012; 3=April 2012–March 2013; 4=April 2013–March 2014; and 5=April 2014–March 2015), time of year (November–February and March–October), part of week (weekday and weekend) and time of day (08:00–22:00 and 22:00–08:00) were derived from the arrival date and time fields in HESAE.
We excluded from the analysis 2.5% of attendances that did not have a valid age, gender, IMD quintile or disposal code.
Statistical methods
We used mixed-effects logistic regression to estimate the association between the odds of a patient being admitted to hospital and the impact of each of the potential explanatory variables. Initial univariate analysis indicated markedly different unadjusted odds of admission for children and adults and between patients conveyed by ambulance and those who arrived by some other means (henceforth referred to as walk-ins). These differences remained substantial having adjusted for other covariates. Given that the records available to build models were plentiful, to minimise the reliance on interaction terms and to increase the model accuracy, we developed four separate models for ambulance-conveyed children, walk-in children, ambulance-conveyed adults and walk-in adults.
All candidate predictor variables were included in the model on the basis of adequately strong univariate association with the outcome variable or because inclusion improved the fit of the multivariate model. The hospital trust (provider) of the ED was included as a random effect to reflect clustering of attendances within hospital trusts. Final model fit was measured using the C-statistic (area under the receiver operating characteristic curve), calibration plots and the Hosmer-Lemeshow goodness-of-fit test.
The impact of adding interaction terms was tested as a sensitivity analysis. All two-way interaction terms between the fixed effects (other than arrival year) were tested individually and in combination, for their impact on the coefficients for the arrival year variable. In addition, the coefficients of interaction terms between arrival year and each of the other fixed effects were assessed.
To further explore changes in admission thresholds over time, we applied the casemix-adjusted odds of admission from year 1 to attendances in years 2–5.
Data processing was conducted in Microsoft SQL Server 2012 and analysis in R V.3.2.3 statistical software package.
Results
Description of ED attendances
The analysis included 20.2 million ED attendances at 47 hospitals trusts (online supplementary file 1) between 1 April 2010 and 31 March 2015 (figure 1).
Supplementary file 1

Selection of study population.
There were 4.81 million attendances (28%) for patients aged 0–17 years, and of these 605 000 were conveyed to ED by ambulance and 4.21 million by walk-in. There were 15.4 million (72%) aged 18+ years, and of these 5.47 million were conveyed to ED by ambulance and 9.94 million by walk-in.
The number of attendances increased by an average of 1.8% per year from 3.89 million in year 1 to 4.18 million in year 5 (table 1). The most common primary diagnoses were dislocation/fracture/joint injury/amputation, gastrointestinal conditions, sprain/ligament injury, laceration, respiratory conditions and contusion/abrasion, each with more than 1 million attendances during the study period (online supplementary file 2, table B1). Thirty-two per cent of attendances occurred during the winter (November–February), 29% on the weekend (similar to the rate of activity during the week) and 19% overnight (22:00–08:00). Six per cent of patients attending ED had attended in the previous 28 days but had not been admitted; a further 4% had attended ED and been admitted (online supplementary file 2, table B2).
Supplementary file 2
Patient characteristics of attendances
Recording of patients’ ethnicity improved substantially, increasing from 30.5% in year 1 to 90.1% in year 5.
Model description and model fit
In each of the four models, age group, gender, deprivation, ethnicity, diagnosis, arrival year, time of year, part of week and time of day of attendance, activity in the previous month, and year of attendance were included in the model as fixed effects. The hospital trust (provider) of the ED was included as a random effect.
A full description of the four models, including ORs for the fixed effects and SD for the random effect, can be found in online supplementary file 3, tables C1–5.
Supplementary file 3
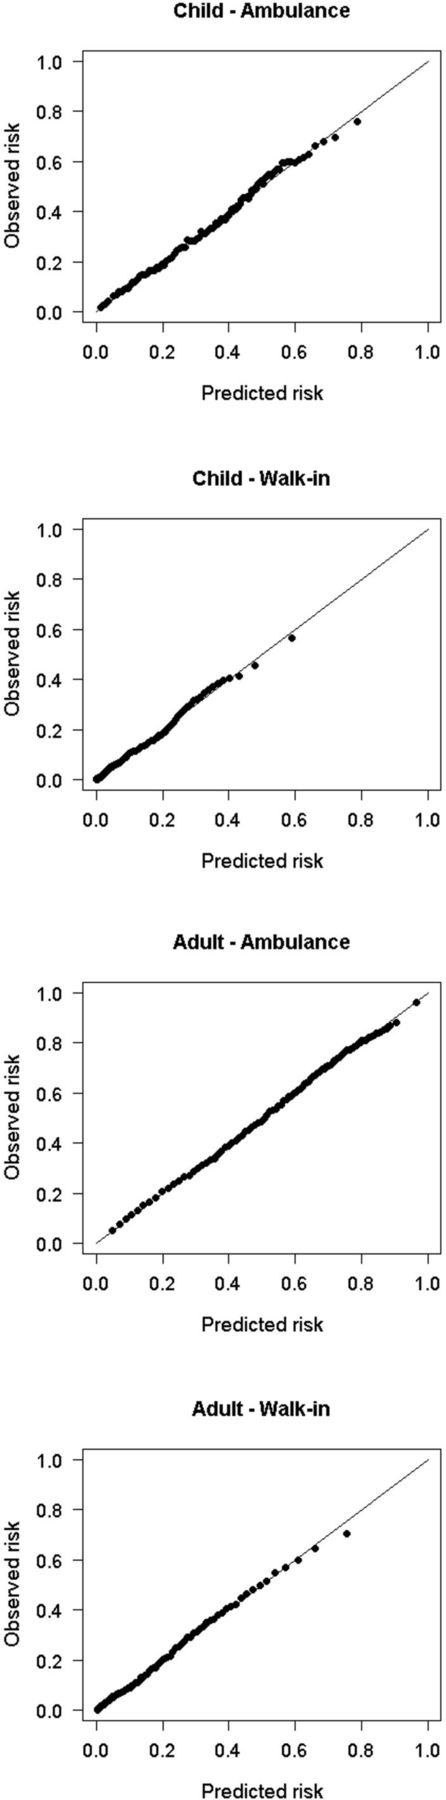
The C-statistic was 0.73 for the child ambulance model, 0.81 for the child walk-in model, 0.76 for the adult ambulance model and 0.84 for the adult walk-in model. Calibration plots are provided in figure 2.

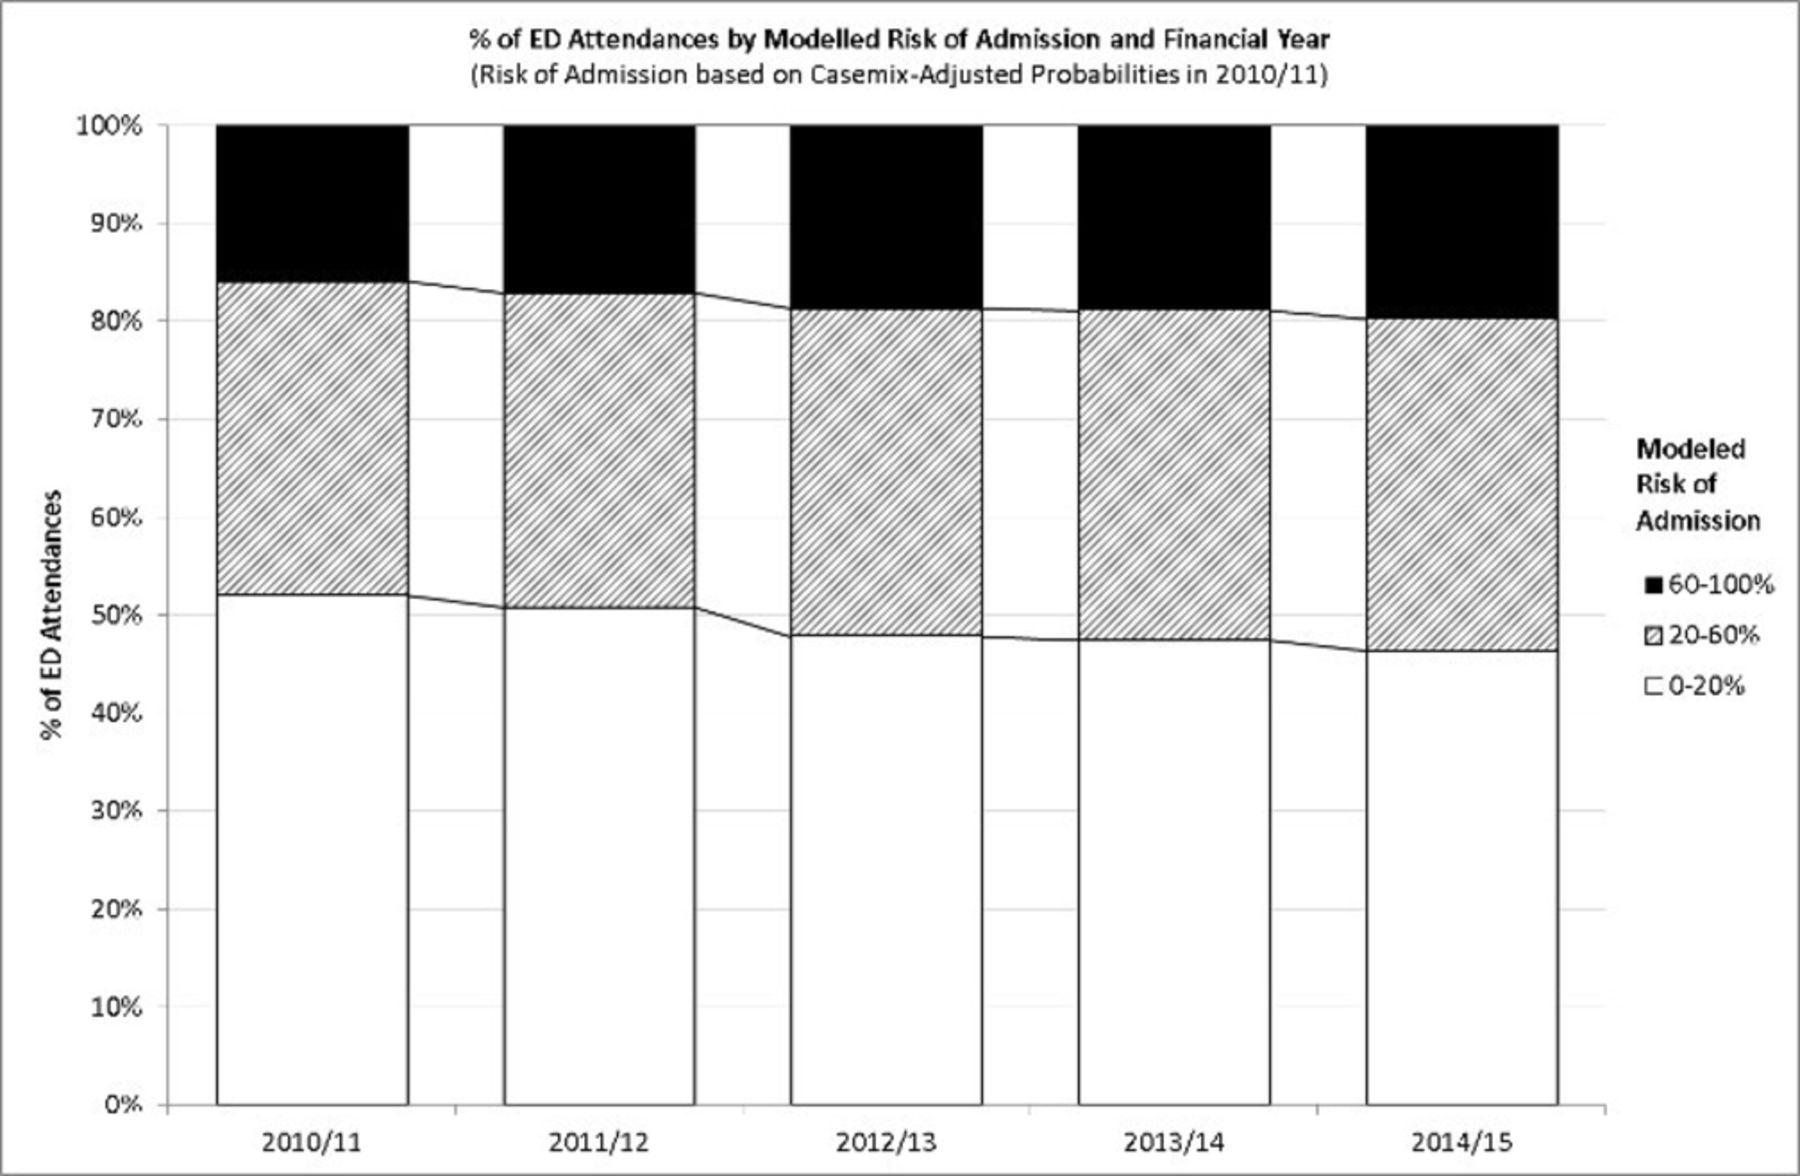
Per cent of ED attendances by modelled risk of admission and year.
Odds of admission by arrival year
The unadjusted and adjusted odds of admission by arrival year are shown in table 2. For children conveyed by ambulance, the unadjusted odds of admission were 9.7% higher in year 5 than in year 1 (OR 1.097, 95% CI 1.079 to 1.116). However, having adjusted for the other covariates in the model, the odds of admission are shown to be 15.2% lower in year 5 than in year 1 (OR 0.848, 95% CI 0.830 to 0.866). The adjusted odds of admission were also considerably lower in year 5 than in year 1 for child walk-in attendances (OR 0.774, 95% CI 0.765 to 0.783), adult ambulance-conveyed attendances (OR 0.791, 95% CI 0.785 to 0.796) and adult walk-in attendances (OR 0.771, 95% CI 0.765 to 0.776). In each of the four models, the adjusted odds of admission decreased monotonically with arrival year. Effects sizes are shown in online supplementary file 4 as average relative risks and average absolute risk reductions using the approach described by Grant.22
Supplementary file 4
Odds of admission by year
Changes in risk profile of attendances
Of all cases, 27.5% were admitted in year 5. The models suggest that 30.8% of cases in year 5 would have been admitted if they had experienced the casemix-adjusted odds of admission that applied in year 1.
The proportion of low admission risk (P≤0.2) attendances fell from 52.0% in year 1 to 46.3% in year 5 (see figure 2). Correspondingly there were increases in the proportion of high admission risk (P>0.6) attendances over the same period, from 15.9% to 19.7% (figure 3).
Calibration plots.
Sensitivity analyses: inclusion of interaction terms
The inclusion of many of the two-way interaction terms between the fixed effects improved the model fit, but did not materially affect the relationship between the outcome variable and arrival year. In most cases the coefficients of the interaction terms between arrival year and other fixed effects were small (ORs less than 0.5 or greater than 2), with larger coefficients found only with some low volume diagnoses variables.
Discussion
Key findings
Having adjusted for other factors that have previously been shown to be associated with the odds of admission, the four models for child ambulance, child walk-in, adult ambulance and adult walk-in ED attendances independently suggest that the odds of admission have decreased over time.16–20 Patients attending in year 5 are substantially less likely to be admitted than patients attending in year 1 with similar characteristics and at similar times of the year, week and day. Ambulance-conveyed children are 15.2% less likely to be admitted in year 5 than in year 1. The reduction is more marked for other groups: a 22.6% reduction for child walk-in attendances, 20.9% for ambulance-conveyed adults attending and 22.9% for adult walk-in attendances.
While there are a number of potential explanations for this finding, we note that these changes coincide with the development of ambulatory emergency care, the wider use of fast track clinics, increases in the number of emergency medicine consultants and the development of the acute medicine specialty.23 Over the same period there have been increases in the rate of investigations and treatments delivered in ED and in the average time between patients being seen and being discharged from ED.24 25 This was part of the rationale for changing the 4-hour standard from 98% of patients to 95% in 2010.14
We estimate that there would have been 137 000 (11.9%) additional emergency admissions in the selected hospitals in year 5, if the casemix-adjusted odds of admission from year 1 had applied. Estimating the cost to commissioners (or forgone income for providers) of these avoided admissions is not trivial since the average cost of the avoided admissions is likely to be lower than the average cost of all admissions. However, applying the lower decile tariff for emergency admissions provides a conservative savings estimate of £65 million in year 5.
Reductions in average length of stay in hospital and the increase in the number of patients discharged on the same day as admission that have been reported elsewhere should be seen as more remarkable given the increased average acuity of patients admitted via ED.2
In addition we found that the number of attendances with a low risk admission (P<0.2) fell by 1.1% per annum, whereas the number of all other attendances grew by 4.7% per annum. This finding fits with reported increases in general practitioner consultation rates, walk-in centre/minor injuries units attendances, ambulance ‘hear and treat’ and ‘see and treat’ cases.12 26 27
If low admission risk attendances had increased at the same rate as all other attendances, then we estimate that there would have been an additional 564 000 low admission risk attendances in year 5. If we conservatively assume that these attendances would have been charged at the lowest available tariff, then the avoided cost to the commissioner can be estimated at £32 million in year 5.
Relation to existing literature
The effects of casemix variables on the risk of admissions that we found in this study reflect those found in previous published studies, notably an increased risk of admission with ambulance conveyance, old age, attendance during the daytime and during the week, and with recent prior admissions.16–18 28 There is considerable interest in the number of deaths in hospitals in England during the weekend, and one paper has suggested that the ‘weekend-effect’ might be explained by a lower probability of admission at the weekend.28 This paper also finds that the casemix-adjusted odds of admission are lower on the weekend (see online supplementary file 3, table C3).
Limitations
The models are built on a subset of ED attendances. While some exclusions are justified from a design perspective (eg, excluding follow-up attendances), others are based on the availability of coded covariates. Limiting the study population to those hospitals where at least 70% of attendances have a valid diagnosis code and 95% have a valid disposal code in each year of the study introduces the potential for selection bias and raises questions about the extent to which the model can be generalised to all EDs. We note however that no significant interactions were found between the design variable representing ‘diagnosis not classified’ and arrival year. Exclusions for other data quality reasons (eg, missing data on gender, lower super output areas) represent only 2.5% of attendances.
We are not aware of any fiscal incentives that might induce providers to systematically misclassify patients’ diagnoses in ED in favour of those diagnoses with the greatest risk of admission. Note that unlike inpatient admissions, a patient’s diagnosis in ED does not alter the charge for the attendance or influence high profile quality metrics such as the hospital standardised mortality ratio. Substantial changes in the frequency of diagnoses were largely confined to growth in low volumes diagnoses and between years 1 and 2, whereas we find that the casemix-adjusted odds of admission reduced in all years. Diagnoses of septicaemia grew in each year in line with interventions to improve the identification of this condition in ED.
Previous literature has indicated that other factors not included in our models may influence the odds of admission, notably the relative business of the ED, bed occupancy and the distance travelled to ED.11 19 20 29 While the precise estimate of the casemix-adjusted odds of admission by arrival year would no doubt change with the inclusion of these variables, it seems unlikely that this would have a material impact on the headline findings.
Although information about the investigations and treatments delivered in ED was available in the HESAE data sets, these were not included in the model because these variables represent the ED response to presenting patients rather than the intrinsic characteristics of patients as they present. Indeed, increases in the number of investigations and treatments in ED may be one of the means by which admission thresholds have been increased.
Age is used as a casemix adjustment variable. If age did not confer a constant risk (of admission) over time, then this might explain some or all of the observed reductions in casemix-adjusted odds of admission. This is indeed feasible if we consider that life expectancy is known to be increasing, and for older adults age can be thought of as a proxy for the latent variable, proximity to death. However, tests for interactions between the age and arrival year variables did not support this hypothesis.
We considered whether the observed results may be explained in part by the considerable improvements in recording of a patient’s ethnicity. However the arrival year coefficients were not materially altered by limiting the models to cases with a valid ethnicity or by introducing an interaction term between ethnicity and arrival year.
The outcome variable for the model is admission directly from ED. In some cases, patients may be referred elsewhere for immediate attention (eg, to a fracture clinic) and as a result of this contact be admitted to hospital on the same day. An increase in the frequency of these indirect routes to admissions may explain some or all of the observed reduction in the odds of (direct) admission. We note however that the number of patients attending ED who are referred to A&E clinic, fracture clinic or other outpatient clinics has not changed substantially over the study period (11.0% in year 1 to 10.4% in year 5).
Implications for policy and research
This analysis suggests activity has changed in line with the long-standing UK health policy to ensure that patients access ED and are admitted to hospital only when clinically necessary. It should be noted, however, that this study did not attempt to assess the consequence of these changes on patient experience or outcomes.
Against a backdrop of increasing average acuity of ED attendances without increases in hospital beds (see online supplementary file 1, table A2), policy makers need to regularly review the trade-off between two goals: the narrow process-based target of managing 95% of ED cases within 4 hours and the wider goal of eliminating avoidable or unnecessary hospital admissions.
Additional work would be required to determine whether this approach could be used to compare the casemix-adjusted odds of admission between individual providers.
Further research to explore whether the reduction in odds of admission over time holds when one considers admissions that follow indirectly from an ED attendance (eg, from ED to urgent outpatient clinic to admission) would provide another pathway for consideration. This might equally be explored by evaluating the effectiveness of these urgent outpatient clinics in preventing admissions.
Conclusion
Whereas trends in admissions imply that admission avoidance strategies are not working, casemix-adjusted odds of admission reveal a different story. Providers, commissioners and policy makers may benefit from calculating and tracking the casemix of patients presenting at ED and the casemix-adjusted odds of admission as a means of evaluating the impact of interventions to reduce hospital admissions.
Acknowledgments
The authors would like to thank Alison Turner, Abeda Mulla, Paul Seamer and Peter Spilsbury for reviewing the draft manuscript.
Footnotes
Contributors SW and AH conceived the work. KC conducted and AH supervised the preliminary data analysis. SW conducted the final data analysis and wrote the first draft of the paper. MAM provided methodological and statistical advice. MC provided clinical and operational interpretation of the findings. All authors commented on draft versions and approved the final version of the article.
Competing interests None declared.
Provenance and peer review Not commissioned; externally peer reviewed.
Data sharing statement All data used are published.