Article Text

Abstract
Objectives We created Physician Navigators in our ED to help improve emergency physician (EP) productivity. We aimed to quantify the effect of Physician Navigators on measures of EP productivity: patient seen per hour (Pt/hr), and turn-around time (TAT) to discharge. Secondary objectives included examining their impact on measures of ED throughput for non-resuscitative patients: ED length of stay (LOS), door-to-physician time and left-without-being-seen rates (LWBS).
Methods In this retrospective study, 6845 clinical shifts worked by 20 EPs at a community ED in Newmarket, Canada from 1 January 2012 to 31 March 2015 were evaluated. Using a clustered design, we compared productivity measures between shifts with and without Physician Navigators, by physician. We used a linear mixed model to examine mean changes in Pt/hr and TAT to discharge for EPs who employed Physician Navigators. For secondary objectives, autoregressive modelling was performed to compare ED throughput metrics before and after the implementation of Physician Navigators for non-resuscitative patients.
Results Patient volumes increased by 20 patients per day (p<0.001). Mean Pt/hr increased by 1.07 patients per hour (0.98 to 1.16, p<0.001). The mean TAT to discharge decreased by 10.6 min (−13.2 to −8.0, p<0.001). After implementation of the Physician Navigator programme, overall mean LOS for non-resuscitative patients decreased by 2.6 min (p=0.007), and mean door-to-physician time decreased by 7.4 min (p<0.001). LBWS rates decreased from 1.13% to 0.63% of daily patient volume (p<0.001).
Conclusion Despite an ED volume increase, the use of a Physician Navigator was associated with significant improvements in EP productivity, and significant reductions in ED throughput times.
- efficiency
- emergency department operations
- research
- operational
Statistics from Altmetric.com
Key messages
What is already known on this subject?
There has been limited research on different methods to improve physician productivity in the ED. Previous studies have shown that emergency physician scribes are associated with only small improvements in productivity. At our institution, we created the novel role of the Physician Navigator to assist emergency physicians with their non-clinical workload outside of patient documentation.
What this study adds?
We demonstrate that Physician Navigators can lead to significant improvements in emergency physician productivity, and metrics of ED throughput. Physician Navigators were implemented at no net-cost to the hospital or healthcare system. In the setting of increased demand for ED services, Physician Navigators are a new strategy in improving emergency physician productivity.
Introduction
Burnout rates for emergency physicians (EP) continue to be among the highest in medicine.1 2 One of the most commonly cited sources of stress contributing to disillusionment is bureaucratic and regulatory tasks that add little value to patient care, and divert time from direct patient care.1–3 In an environment of limited resources and increasing demand for ED services, the pressure on physicians to increase productivity has only increased.
We created the position of Physician Navigator to help improve the productivity of EPs. A Physician Navigator is hired and fully remunerated by an EP to help reduce the non-clinical workload during a shift. Physician Navigators are non-licensed healthcare team members that assist in activities which are often clerical in nature, but directly impact the quality of patient care. They do not participate in clinical documentation or patient assessments. The main objective of this study was to study the impact of Physician Navigators on EP productivity indicators. For secondary objectives, we examined the impact of Physician Navigators on metrics of ED throughput. We were also interested in levels of EP satisfaction with Physician Navigators, and changes in patient satisfaction.
Methods
Setting and population
The study occurred at Southlake Regional Health Center (Southlake), a 400-bed community hospital in Newmarket, Ontario. From 1 January 2012 to 31 March 2015, the ED received over 317 000 patients. At Southlake, EPs did not have designated areas within the ED, and assessed patients with all levels of acuity. ED shifts also had the same duration. The Physician Navigator programme was officially started on 1 April 2013. We conducted a retrospective 39-month observational, non-randomised, comparative study. The Southlake Research Ethics Board provided ethics approval.
EPs at Southlake had the option of hiring Physician Navigators at any point after 1 April 2013. Since it was a voluntary programme, EPs were not compelled or incentivised to employ Physician Navigators, and could discontinue their use at any time. EPs submitted requests for Physician Navigators in advance. If a Physician Navigator was available for that EP’s shift, they would be scheduled.
Physician Navigator training and duties
Physician Navigators were trained over 6–8 shifts with a Physician Navigator trainer. The main role of Physician Navigators was to improve EP efficiency through minimising time spent on non-clinical tasks that were normally completed by EPs, or time before and after all patient assessments. Physician Navigators would always have the next one to two patients ready for the physician to assess. This included placing patients into exam rooms, checking for relevant clinical history (eg, pulling up recent results, hospital visits, instructing patients to have medications on-hand for the EP), and collecting equipment that the EP may need (eg, ultrasound machines, suture kits). While the EP was assessing patients, Physician Navigators would actively monitor the ED for patient reassessments, and prepare the results. Reassessments were generally prioritised over new patient assessments unless wait times for initial assessments exceeded 60 min. Physician Navigators carried the physician phone and were responsible for filtering incoming calls, and paging specialists. Other routine tasks included using the ED electronic patient tracking system, facilitating patient-related paperwork for the EP, monitoring patient wait times and acting as an additional point of contact to their EP. For paperwork, Physician Navigators acquired and filled non-medical sections, and completed any administrative tasks required. This included preparing and submitting workplace injury forms, or arranging outpatient referrals and providing instructions to patients on discharge. For situations that involved multiple physicians, Physician Navigators were responsible for coordinating between different members of the healthcare team. Further details about the inception, structure, training and maintenance of the Physician Navigator programme are provided in online supplementary file 1.
Supplementary file 1
Outcomes
The main objective of this study was to study the impact of Physician Navigators on EP productivity indicators: patients treated per hour (Pt/hr), and turn-around time (TAT) to discharge. Secondary objectives include examining the impact of Physician Navigators on ED length of stay (LOS), door-to-physician time and left-without-being-seen rates (LWBS).
Pt/hr was calculated as the number of patients evaluated over the entire shift, divided by the duration of the shift. Patients who were ‘handed over’ to a physician were not counted towards the receiving physician’s Pt/hr. TAT to discharge (minutes) was calculated as the difference between time of physician initial assessment and the time a physician makes an order for patient discharge or admission.
For secondary objectives, ED throughput outcomes were LOS for Canadian Triage and Acuity Scale (CTAS) 2–5 patients, door-to-physician time and daily LWBS rates. LOS was calculated as the difference between the earlier of triage or registration time, and the time the patient physically left the ED or were admitted and physically left the ED. Door-to-physician time was calculated as the difference between the earlier of triage or registration time to the start of EP assessment. LWBS was calculated as a percentage of daily ED volume.
Lastly, all EPs in our ED who used Physician Navigators anytime during the study period were surveyed in April 2015 to measure their satisfaction with the Physician Navigator programme. Although the shifts of 10 out of the 24 EPs who were surveyed did not meet study inclusion criteria for productivity analysis, we were still interested in their opinion of Physician Navigators. The anonymous survey composed of three questions on 5-point Likert scales was completed online (see online supplementary file 1). Patient satisfaction with the ED was measured with a standardised 64-question survey from the National Research Corporation of Canada.4 The anonymous survey was routinely administered in our ED on a quarterly basis, and we collated results relevant to the study period.
Design and data analysis
We studied the shifts of EPs who met the following criteria: (1) had privileges and were working at Southlake ED throughout the study period and (2) worked at least three shifts per month throughout the study period. There were over 30 EPs with staff privileges at Southlake ED during the study period. In total, the shifts of 20 EPs working 6845 shifts clinical shifts were evaluated. Out of the 20 EPs studied, 13 used Physician Navigators at least regularly (defined as having Physician Navigators for >30% of total ED shifts after 1 April 2013).
For our main objective, we wanted to evaluate the mean effect of Physician Navigators on the productivity indicators of the 13 EPs who used them. This involved comparing physician shifts with Physician Navigators against shifts completed by the same physician without Physician Navigators. By separating shifts by ED physician, we naturally created groups or clusters. This clustered study design required statistical models which accounted for differences between and within clusters. Accordingly, we used a linear mixed model to examine the impact of Physician Navigators on productivity indicators. Mixed models account for differences between and within physicians, the fact that repeated measures in the same physician were correlated, and for unequally sized clusters.
Next, we wanted to study whether the effect of Physician Navigators on productivity indicators varied by how often they were used by EPs. Physicians in the study were divided into three subgroups. Group 0 consisted of seven physicians who did not use Physician Navigators. Group 1 consisted of seven physicians who used Physician Navigators regularly, defined as using Navigators for 30%–85% of total shifts since April 2013 (mean 54.7%, SD 17.3%). Group 2 consisted of six physicians who used Physician Navigators for almost every shift, defined as >85% of total shifts since April 2013 (mean 92.4%, SD 6.1%). Under this design, group 0 acted as a negative control group, and groups 1 and 2 could assess whether the impact of Physician Navigators on productivity measures varied on how frequently the EP employed Physician Navigators.
At the beginning of the Physician Navigator programme, the EPs within group 2 explicitly wanted Physician Navigators for all shifts. However, there were not enough trained Physician Navigators to meet this demand. This practical limitation prevented group 2 physicians from having Physician Navigators 100% of the time. Out of 1066 shifts completed by group 2 EPs after 1 April 2013, 87 (8.1%) of those shifts occurred without a Physician Navigator. Most of these shifts occurred within the first few months of the Physician Navigator programme. For data analysis, since group 2 physicians desired Physician Navigators (and it was the programme’s fault for not being able to supply them), we conservatively treated the 87 shifts as if they were with a Physician Navigator.
For secondary objectives, we divided our data into pre-Physician and post-Physician Navigator intervals starting on 1 April 2013. T-tests were used to compare descriptive statistics for patients before and after Physician Navigators. The following patients were excluded from secondary analysis: Resuscitative patients (CTAS 1), died or dead on arrival in the ED, direct admissions to a service, and transferred to another facility. This was done because they circumvent the usual ED intake processes, and do not represent a substantial burden to ED throughput at our institution. For each patient, LOS and door-to-physician times were calculated. Auto-regressive time-series analysis was used to describe the impact of Physician Navigators on measures of overall ED efficiency while controlling for the independent variables related to patient throughput, including daily patient volume, and number of EPs per day.
The level of statistical significance was α=0.05. For subgroup analysis, a Bonferroni correction was applied to control for type 1 error inflation. Missing data were excluded from statistical analysis. Primary and secondary outcome analyses were performed using R V.3.2.1 (R Foundation for Statistical Computing, Vienna, Austria). All other analysis was performed using IBM SPSS V.20.0 (IBM, Armonk, New York, USA). Further details about the statistical methods used in the study are provided in online supplementary file 1.
Data extraction
The study used a computerised ED information system which integrates patient tracking and patient charted data (STAR McKesson, McKesson, San Francisco, California, USA and Med2020, MED2020 Health Care Software, Orleans, Ontario, Canada). Database queries with Microsoft Access (Microsoft, Redmond, WA, USA) collected throughout data for all patients received in the ED prospectively from 1 January 2012 to 31 March 2015. EP and Navigator schedules were manually generated each month.
Results
We studied 6845 shifts (2469 shifts before, and 4376 shifts after 1 April 2013) across 20 EPs, with the number of shifts ranging from 122 to 599 for each physician. Table 1 summarises the characteristics before and after the implementation of the Physician Navigator programme. There was a significant increase in daily patient volume (255.2 vs 274.9, p<0.001). This increase mainly consisted of CTAS 2 and 3 patients (10 and 7 additional patients per day, respectively). The number of physician hours (54.4 vs 52.0, p<0.001) and shifts (7.1 vs 6.8, p<0.001) per day decreased significantly. No other descriptors differed significantly.
ED characteristics during preintervention period (1 January 2012 to 31 March 2013) and postintervention period (1 April 2013 to 31 March 2015)
The results of linear mixed models to evaluate the impact of Physician Navigators on productivity variables are presented in table 2. For the 13 EPs who used Physician Navigators, the number of patients seen per hour increased by 1.07 Pt/hr (0.98 to 1.16, p<0.001). The TAT to discharge decreased by 10.6 min (−13.2 to −8.0, p<0.001).
Results from linear mixed models: impact of Physician Navigators on productivity indicators for all physicians who employed Physician Navigators, and by how often Physician Navigators were used by physician subgroups
In the subgroup analysis, for goup 0, there was no significant change in the Pt/hr, and a decrease of 8.6 min (−12.1 to −5.6, p<0.001) in TAT to discharge after the Physician Navigator programme was implemented. For goup 1, the Pt/hr increased by 1.02 Pt/hr (0.92 to 1.16, p<0.001) and TAT to discharge decreased by 3.8 min (−6.9 to −0.7, p=0.016). The Pt/hr increased by 1.15 Pt/hr (1.00 to 1.30, p<0.001) and TAT to discharge decreased by 22.5 min (−27.3 to −17.7, p<0.001) for group 2 physicians (table 2).
For secondary outcomes, after the implementation of the Physician Navigator programme, there was a decrease in mean LOS by 2.6 min (0.74 to 4.50, p=0.007). As seen in figure 1, when separated by acuity and disposition, there were significant decreases in mean LOS for non-admitted CTAS 2 by 10.3 min (0.91 to 19.7, p=0.038), 3 by 19.3 min (12.2 to 26.3, p<0.001) and 4 by 8.1 min (3.4 to 12.8, p=0.003). There were no significant changes in LOS for CTAS 5 or CTAS 2–4 admitted patients. Mean door-to-physician time decreased by 7.4 min (4.8 to 9.9, p<0.001) for non-resuscitative patients (figure 2). LWBS rates decreased by 0.50% of daily patient volumes (0.33% to 0.66%, p<0.001). These improvements were sustained throughout the study period.
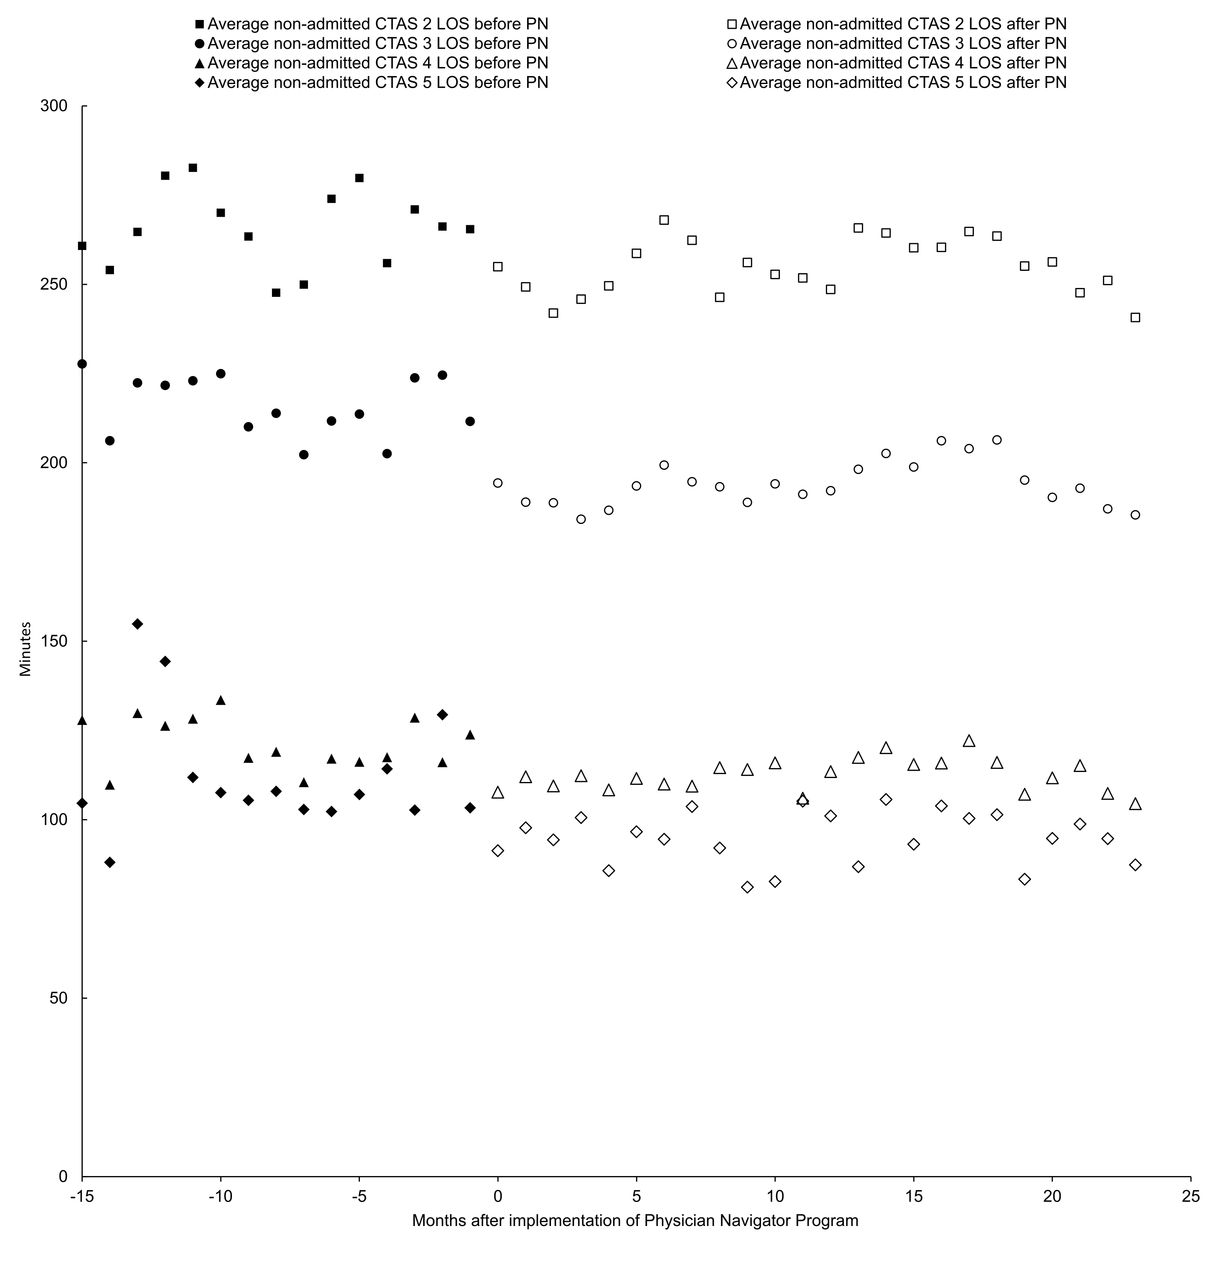
Monthly averages of ED length of stay (LOS) for non-admitted Canadian Triage and Acuity Scale (CTAS) 2, 3, 4 and 5 patients before and after the implementation of Physician Navigators (PN).

Monthly averages of ED patient volumes and door-to-physician times for Canadian Triage and Acuity Scale 2–5 patients, before and after the implementation of Physician Navigators.
Twenty-four physicians who used Physician Navigators at any point during the study period were surveyed. The survey was completed by 95.8% of those surveyed; 95.7% of respondents were satisfied with the Navigator programme (82.6% strongly agree), and 100% of respondents agreed that Navigators improved the quality of care they provided (78.3% strongly agree) and made their practice more efficient (87.0% strongly agree). There were no significant changes in levels of ED patient satisfaction (see online supplementary file 1).
Discussion
This study introduces the novel role of the Physician Navigator in the ED. When EPs in our ED worked with Physician Navigators on a shift, they could experience a 23.8% increase in patients seen per hour, and a 6.5% reduction in TAT to discharge. The subgroup analysis indicated that EPs who used Physician Navigators more often saw higher levels of productivity gains compared with EPs who used them less often. There was a significant reduction in TAT to discharge by 8.6 min for physicians who did not use Physician Navigators. We were not aware of any other process during this period that may have led to this reduction. However, the ED is a team environment and Physician Navigators do help physicians that they are not working directly for, such as sorting patients to be seen for other physicians. Anecdotally, nurses in our ED reported improved efficiency due to fewer workflow interruptions, and being able to access EPs more easily. This may have contributed to the reduction in TAT to discharge observed for EPs who did not employ Physician Navigators.
Despite an increase in patient volumes, Physician Navigators were associated with a small reduction in overall LOS for non-resuscitative patients. This improvement in LOS was mainly observed in non-admitted patients. When compared with the study period prior to Physician Navigators, Physician Navigators were associated with modest reductions in door-to-physician time (12.0%) and LWBS (43.9%).
Our study demonstrates how EPs could experience up to a 23.8% increase in patients seen per hour, and 12.3% reduction in TAT to discharge by having Physician Navigators reduce their non-clinical workload. By allowing EPs to focus on clinical tasks, EPs could assess more patients per shift without lengthening its duration. This allowed our ED to accommodate a 7.8% (20 patients) increase in daily patient volume and improve throughput metrics without any increase in physician staffing. EPs reported high rates of satisfaction with the programme, and that their work was easier and of a higher quality despite an increase in number of patients seen. The proportion of EPs using Physician Navigators for every shift has gone from 20.0% in April 2013 to 93.3% in December 2016. Since EPs hired and directly benefited from Physician Navigators, these improvements were achieved at no net-cost to the hospital or healthcare system.
The Physician Navigator programme can be compared with ED scribes. The defining characteristic which differentiates Physician Navigators from scribes is that Physician Navigators are not involved in medical documentation. During its development, we believed that significant improvements in physician productivity could be achieved without including documentation, a task that physicians have traditionally completed and fraught with medicolegal significance.5 6 Accordingly, the training of scribes required specialised programmes, and ideal candidates would possess background knowledge in medicine. Indeed, certain scribe programmes required years of prior clerical experience, and had training programmes up to 118 hours without including at-home coursework.7 8 For scribe candidates, programmes targeted preclerkship medical students or undergraduate students aspiring for a medical career.7–9 Inevitably, the latter has resulted in high rates of scribe turnover.10 In contrast, we sought Physician Navigators from a larger pool of potential applicants within the service and restaurant industry (eg, sale assistants, baristas and wait-staff). Applicants did not require any medical knowledge, and received approximately 60 hours of total training. As a Physician Navigator developed and their productivity improved, demand for their services within our physician group would increase. This resulted in promotion to higher levels of hourly wages, and employee retention.
Heaton et al published a systematic review on the effect of scribes in the ED.9 They completed a meta-analysis of four studies that reported patients per hour changes with scribes, and found a small 0.17 Pt/hour increase. There was no significant impact on TAT to discharge or patient LOS.9 These results were similar to a recent study which found a 0.11 Pt/hr increase with scribes.11 Three studies have found reductions in door-to-physician time by 3.6 (4.4%), 7 (9.4%) and 22 min (36%).12–14 Hess et al.15 found that their scribe intervention reduced LWBS rates by 20%.9 Available studies have estimated the initial cost of an ED scribe programme can range from US$31 800 to US$81 000.7 16
Although we did not perform a cost-benefit analysis, we believe EPs who employ a Physician Navigator would likely generate enough revenue that the potential revenue associated with a Physician Navigator would far exceed the cost of the Physician Navigator. In 2015, Physician Navigators were paid US$12 to US$24 per hour (mean US$16, minimum wage was US$11.25).17 Physicians were also responsible for a fee of US$30 per shift with a Physician Navigator to the Physician Navigator programme administrator for scheduling, training and day-to-day operations. This is compared with the baseline fee of US$35.65, a physician receives for assessing a new patient in the ED during a weekday.18 Increased uptake and physicians’ willingness to pay for Physician Navigators provides additional, although circumstantial evidence, that they likely increase income and productivity. The hospital was responsible for allowing credentialing, and ensuring compliance with insurance, liability and patient confidentiality issues. Furthermore, since Physician Navigators were directly funded through their improvements to EP efficiency, they were not subjected to the bureaucracy of being a programme funded by hospital dollars.
Our physician group operates under a fee-for-service remuneration paradigm. However, we believe EPs and institutions under alternative funding models can benefit from Physician Navigators. Like scribes, they are a method of enhancing EP productivity without increasing EP staffing. Furthermore, Physician Navigators allow EPs to focus on providing patient care, and present a novel way of addressing the issue of increasing physician dissatisfaction due to the burden of non-clinical bureaucratic tasks.19
Limitations
The generalisability of our results is limited by the retrospective, non-randomised and single-site study design in a Canadian setting. However, given the complex ED setting where the priority was improving patient outcomes, it was impractical to host a randomised controlled trial. Our results may not be as applicable to hospitals with less patient volume, or academic institutions. Our ED does not use electronic charting for physician documentation. The inception of the programme involved creating a new employee position at our hospital that remained within the full control of the physicians. This process involved meeting with administrators, union officials and lawyers. Our intervention was designed to be self-sufficient without physician supervision. Other institutions may prefer different approaches to the development and management of their own Physician Navigator programme.
Although Physician Navigators were created to enhance physician productivity, certain EPs employed Physician Navigators for additional reasons like fostering a team environment during shifts or increasing patient-physician interaction time. These potential benefits of Physician Navigators would likely not be observed as improvements in Pt/hr or TAT to discharge. In comparison to day shifts, patient volumes during overnight shifts tended to be lower. We did not separate out night shifts for analysis. Accordingly, the impact of Physician Navigators on productivity indicators during night shifts may be diminished. Given the variations in how Physician Navigators were used, it is possible that the impact of Navigators on productivity indicators was underestimated. This could also account for the variable results in TAT to discharge after subgroup analysis. We did not control for physician shifts at the same time of day. We could not formally study differences in clinical practice between EPs who used and did not use Physician Navigators. Since group 0 EPs had the lowest mean TAT to discharge prior to the implementation of Physician Navigators, it is possible that the effect of Physician Navigators on TAT to discharge is limited to EPs who have a comparatively slower clinical practice.
EPs at Southlake submit requests for Physician Navigators. If a Physician Navigator is available, they are booked with the EP. For group 1, it is possible that certain EPs only hired Physician Navigators for certain shifts (ie, weekend), or were more productive because they were paying for a service. Although we were not aware of this occurring, this confounding and placebo effect could lead to an overestimation of the impact of Physician Navigators on metrics of productivity.
After the study completion, we became aware of a delay in the time a discharged patient was documented to have physically left the department. Although a patient may have been physically discharged at the time the EP decided disposition (ie, TAT to discharge), a nurse attending to other tasks would not be able to document the most accurate ‘time left ED’ (ie, nursing only documents the time they physically have the chart in hand). This created an artificial lengthening of LOS. Despite the improvements in door-to-physician and TAT to discharge, this occurrence likely underestimated the impact of Physician Navigators on LOS. A clinical example is provided in online supplementary file 1.
The creation of Physician Navigators to assist EPs with their non-clinical workload was associated with significant improvements in EP productivity, and metrics of ED throughput. Future research is required to determine its impact on career longevity, and how various initiatives to improve EP productivity can be integrated.
Footnotes
Contributors All authors listed have contributed sufficiently to the project to be included as authors. AKL, GP, EC and MD had full access to all the data in the study and take responsibility for the integrity of the data and the accuracy of the data analysis. AKL, GP, EC and MD were responsible for study concept and design. AKL, GP, BEC, ZG, EC, EF and MD were involved in the acquisition, analysis or interpretation of data, drafting of the manuscript and critical revision of the manuscript for important intellectual content.
Competing interests MD is the founder of the Physician Navigator programme at Southlake. MD did not receive any funding or compensation for his role in the creation of the Physician Navigator programme, and was not compensated for his contributions to this work. The Physician Navigator programme did not provide any funding support for this work. EF was hired as a Physician Navigator in 2016. He was not a Physician Navigator during the study period, and was not compensated for his contributions to this work. The other authors have no conflicts to disclose.
Ethics approval Southlake Regional Health Centre Research Ethics Board.
Provenance and peer review Not commissioned; externally peer reviewed.