Article Text

Abstract
Objective The aim of this study was to develop models that predict hospital admission to ED of patients younger and older than 70 and compare their performance.
Methods Prediction models were derived in a retrospective observational study of all patients≥18 years old visiting the ED of a university hospital during the first 6 months of 2012. Patients were stratified into two age groups (<70 years old and ≥70 years old). Multivariable logistic regression analysis was used to identify predictors of hospital admission among factors available immediately after patient arrival to the ED. Validation of the prediction models was performed on patients presenting to the ED during the second half of the year 2012.
Results 10 807 patients were included in the derivation and 10 480 in the validation cohorts. The strongest independent predictors of hospital admission among the 8728 patients <70 years old were age, sex, triage category, mode of arrival, performance of blood tests, chief complaint, ED revisit, type of specialist, phlebotomised blood sample and all vital signs. The area under the curve (AUC) of the validation cohort for those <70 years old was 0.86 (95% CI 0.85 to 0.87). Among the 2079 patients ≥70 years, the same factors were predictive, except for gender, type of specialist and heart rate; the AUC was 0.77 (95% CI 0.75 to 0.79). The prediction models could identify a group of 10% of patients with the highest risk in whom hospital admission was predicted at ED triage, with a positive predictive value (PPV) of 71% (95% CI 68% to 74%) in younger patients and PPV of 87% (95% CI 81% to 92%) in older patients.
Conclusion Demographic and clinical factors readily available early in the ED visit can be useful in identifying patients who are likely to be admitted to the hospital. While the model for the younger patients had a higher AUC, the model for older patients had a higher PPV in identifying the patients at highest risk for admission. Of note, heart rate was not a useful predictor in the older patients.
- geriatrics
- hospitalizations
- emergency department
- aged
- research
- epidemiology.
Statistics from Altmetric.com
Key messages
What is already known on this subject
Patients presenting to the ED are at risk for hospital admission, functional decline and mortality, with older patients having even higher risks.
Clinical decision-making tools for older patients in the ED have not been found to be effective.
It is unknown whether independent predictors may vary between age groups, which may influence the design of future tools.
What this study adds
The models created in this study indicate that predictors of hospital admission from the ED are similar for younger and older patients, but differ in their prognostic capabilities. The overall prognostic ability of the models was greater for the patients under 70, but the model for older patients is better at identifying the group of patients very likely to be admitted.
These results constitute preparatory work towards creating a screening instrument that could adequately predict hospital admission, particularly for older adults.
Introduction
Older adults presenting to EDs for medical care frequently are admitted to the hospital.1–4 Despite a high probability of admission, they are at risk of having prolonged length of stay in the ED, which increases the chance of in-hospital adverse events.5 If ED physicians had an accurate decision-making tool they could use early during the ED visit to predict which older patients have the highest probability of being admitted using routinely available demographic and clinical factors available at triage, ED length of stay might be reduced. Interventions to expedite the admission of older patients might also improve health-related and ED flow and function outcomes. Such a tool, however, is not yet available.6 It also is not yet known if demographic and clinical factors predictive of hospital admission are the same for both older and younger ED patients, and if decision-making tools that comprised these factors perform equally well for both age groups.
Independent predictors of hospital admission of ED patients have been identified7 previously, yet mainly reflect disease severity. The Modified Early Warning Score (MEWS)8 is frequently used to quantify disease severity and can predict probability of hospital admission,9 disposition10 and mortality11 of ED patients. However, physiology, polypharmacy and multiple comorbidities of older patients affect measured vital signs and delay recognition of serious disease; when relying solely on vital signs, a proportion of severely ill older patients requiring admission will not be identified.12 Given the discrepancy in the utility of hospital admission prediction models using vital signs and disease severity when they are applied to different age groups, tools helping to predict need for admission based on other clinical characteristics also might not be equally useful for older and younger ED adult patients. If this is the case, different prediction rules should be derived and used based on patient age.
The goal of this study was therefore to derive prediction models separately for older and younger adults that identify need for hospital admission, using routinely demographic and clinical data available at ED triage. We further aimed to assess how well these prediction models performed for these two age groups. The ultimate aim for this prediction model was for its eventual application in identifying early which patients would be admitted from the ED, potentially improving efficiency of care pathways and reducing ED length of stay.
Methods
Study design and setting
This investigation involved deriving and validating a hospital admission prediction rule for adult ED patients. Data were obtained retrospectively from the ED of Leiden University Medical Center (LUMC), which is a tertiary-care hospital with an annual census of approximately 30 000 ED visits. LUMC has an acute medical unit (13 beds) designed to accept admissions from the ED. The Medical Ethics Committee waived the need for informed consent because data were collected as part of past clinical care and de-identified after extraction from the patient files.
Selection of participants
Inclusion criteria
We included all ED visits by adults ≥18 years old to LUMC between 1 January 2012 and 31 December 2012. ED patients who presented between 1 January and 30 June were included in the derivation cohort, while those presenting between 1 July and 31 December were included in the validation cohort.
Exclusion criteria
Patients who arrived to the ED undergoing cardiopulmonary resuscitation (CPR) or classified as Manchester Triage System13 (MTS) category ‘red’ (needing immediate care) were excluded because their likelihood of hospital admission was so great that a prediction tool would not be needed for this population. Patients who died in the ED and those who left without being evaluated also were excluded. In addition, patients with ED visits due to logistical reasons were excluded, such as those attending for a planned re-evaluation because they could not wait until the next available outpatient clinic appointment, visits to the ED because of lack of availability of time in the outpatient clinic, laboratory checks for logistical reasons and patients who were sent away from the ED to visit their general practitioner (figure 1). For this, a predefined list of objective criteria, based on expert opinion, was used. Patient files were checked by a single researcher (JAL) to assess exclusion criteria.

Flow chart of participant selection. Red triage: most urgent triage category, needing immediate care, often in trauma room. ED use for logistical reasons means a preplanned re-evaluation, laboratory check or patient who had left without being seen. Individual visits were included, and there can be multiple visits of one patient in this study. CPR, cardiopulmonary resuscitation.
Study protocol and measurements
Data were automatically harvested from the electronic patient files (ChipSoft-EZIS V.5.2, 2006–2014, Amsterdam, The Netherlands) using an application designed by the LUMC Department of Information Technology. One investigator (JAL) checked the data for validity and corrected typing errors. This was performed by reference to medical records in case of outliers. Furthermore using sampling JAL checked patient records to assess if study data were adequately withdrawn from the patients’ files. The data were not extracted manually and not subject to interpretation. Therefore, a measure of inter-rater variability is not applicable.
Because the aim of this investigation was to develop a tool, using data readily available at triage, the following data were collected: age, sex, MTS triage category, chief complaint, mode of arrival to ED, type of specialist, ED visits within prior 30 days, indication for phlebotomised blood sample testing and vital signs. These variables were chosen by the study authors based on clinical judgement, frequently used variables in similar research,14–16 their availability on patient arrival to the ED and inclusion in the ED electronic medical records. A detailed description of the collection of all variables can be found in the online supplementary material.
Outcomes
The primary endpoint of this study was hospital admission, defined as either admission to the LUMC or transfer to another hospital for admission. This outcome was downloaded directly from the patient files.
Data analysis
Patients were divided into two age groups for analysis, <70 years old and ≥70 years old, in line with the age cut-off used in government-initiated interventions in The Netherlands.17 Data were summarised as number and percentages or means and SD for normally distributed variables, or as medians with IQRs for non-normally distributed variables, as appropriate. Missing measurements of vital signs were handled as a separate category and analysed alongside categories of measured values, for example oxygen saturation has four categories: <90%, 91%–94%, ≥95% and missing, where the reference category is ≥95%. Student’s t-tests assuming independence were used to compare groups for normally distributed variables and Mann-Whitney U tests for non-normally distributed variables. χ2 tests were used for categorical variables. Univariable binary logistic regression was used to assess possible predictors of hospital admission using demographic and clinical characteristics extracted from the medical records. Age (<70 years old or ≥70 years old) as an effect modifier of the relationship between variables in the model and the outcome of hospital admission was tested in the univariable analyses. Multivariable binary logistic regression was used to create an optimal model. ORs and corresponding 95% CIs were estimated. Risks associated with age were expressed per 10-year age groups. The general rule of thumb that at least 10 events per predictor variable are needed to prevent overfitting of the model was used. Because the database contained more than 3000 hospital admissions, all potential predictor variables could be incorporated in the model.18
An optimal model was created for each age group, using backward elimination with Akaike’s Information Criterion to eliminate predictors from the model, with a cut-off point of p<0.05. This made the model as small as possible while still containing all clinically relevant parameters. Goodness of fit was tested using the Hosmer-Lemeshow test, and this was performed 10 times in a random subsample of 1000 patients.
This method standardised the power of the Hosmer-Lemeshow test to prevent overpowering caused by the large number of study subjects.19
Receiver operator characteristics curves were drafted and area under the curve (AUC) estimated to measure the discriminative performance of the models. Temporal validation of the models was performed using data collected from the second half of 2016. Calibration of the models in the validation cohort was assessed using calibration plots.
The distribution of risk of admission per age group was calculated for the validation cohort using the following equation:  . The individual risk of each patient was calculated and ranked. The 10% of the ED patient population, per age group, with the highest chance of hospital admission was designated ‘high risk’. This was deemed a clinically relevant and feasible cut-off point for risk of admission, for which sensitivity, specificity, positive predictive value (PPV) and negative predictive value were calculated.
As a sensitivity analysis, the alternative clinically relevant vital sign cut-off values were assessed as predictors in the models, and their discriminative performance and calibration were reassessed. In a second sensitivity analysis, we created a multivariable model using the whole year 2012 (without dividing the year into successive 6-month blocks of time) and randomly selected a training and test cohort to assess for introduction of bias due to the temporal validation.
Statistical significance was set at the alpha=0.05 level for all analyses. All statistical analyses were performed using IBM SPSS Statistics V.23 package.
Results
Characteristics of study subjects
In 2012, there were 27 862 visits to the LUMC ED, of which 21 287 were included in this analysis (figure 1). The 6575 excluded patients were due to ED use for logistical reasons or arrival during CPR (n=1486), patients aged
Baseline characteristics of the study population stratified by age group are shown in table 1. The distribution of demographics and clinical characteristics by age group was similar within the derivation and validation cohorts.
Baseline characteristics of study population
In the derivation cohort, 2014 (23.1%) younger patients and 898 (43.2%) older patients were admitted to the hospital. In the validation cohort, 2030 (24.1%) younger patients and 919 (44.4%) older patients were admitted. Baseline characteristics between patients in the derivation cohort admitted to hospital and those discharged are shown in table 2.
Baseline characteristics of study population, the derivation cohort stratified around hospital admission
Relationship of patient demographics and clinical factors to hospital admission
The univariable analyses examining the relationship between patient demographics and clinical characteristics and hospital admission stratified by the two age groups are provided in online supplementary table 2. The factors associated with hospital admission were the same for both age groups (eg, urgent triage category, phlebotomised blood sample, fever), although the strength of the relationships differed for some factors between age groups. The variables in the final model for the younger patients are age, sex, triage category, arrival mode, chief complaint, ED revisit, type of specialist, phlebotomised blood sample, oxygen saturation, systolic BP, temperature, heart rate and respiratory rate. The variables in the final model for the older patients are triage category, arrival mode, chief complaint, type of specialist, phlebotomised blood sample, oxygen saturation, systolic BP, temperature and respiratory rate.
As shown in the results for the multivariable models by age groups (table 3), urgent triage category, hospital arrival by ambulance, indication for taking a phlebotomised blood sample, presenting complaint of ‘malaise’ or a non-surgical problem, a systolic BP below 100 mm Hg, oxygen saturation below 95%, fever or tachypnoea >30 breaths/min were associated with greater odds of hospital admission for both age groups. Chest pain, loss of consciousness and dyspnoea as a presenting complaint, as well as no measured BP, were associated with a significantly decreased odds of being admitted among older patients, while in younger patients chest pain decreased the probability of hospital admission. In the sensitivity analyses, similar results were found for the relationship between patient demographics and clinical factors and hospital admission when a single model instead of separate models for the two age groups were used (online supplementary table 3), and when a randomly selected training and test cohort were used for these comparisons (online supplementary table 4).
Final multivariable models of hospitalisation of patients at the ED
The AUC of the prediction model for the derivation cohort for hospital admission among patients <70 years old was 0.85 (95% CI 0.84 to 0.86), which was higher than the AUC of the prediction model for ≥70 years old (0.81 (95% CI 0.79 to 0.82)). In the temporal validation cohort, the AUC for younger patients was 0.86 (95% CI 0.85 to 0.87), which also was higher than the model for older patients, which was 0.77 (95% CI 0.75 to 0.79).
The calibration plots in figure 2 show the observed hospital admission rate in relation to the predicted chance of hospital admission in the validation group. The Hosmer-Lemeshow goodness-of-fit test in both groups was p>0.05, suggesting that predicted probabilities are in line with the observed and that the model fit the data well. In a sensitivity analysis using different cut-off points for vital signs in younger and older patients, there were no differences in the performance of either model.
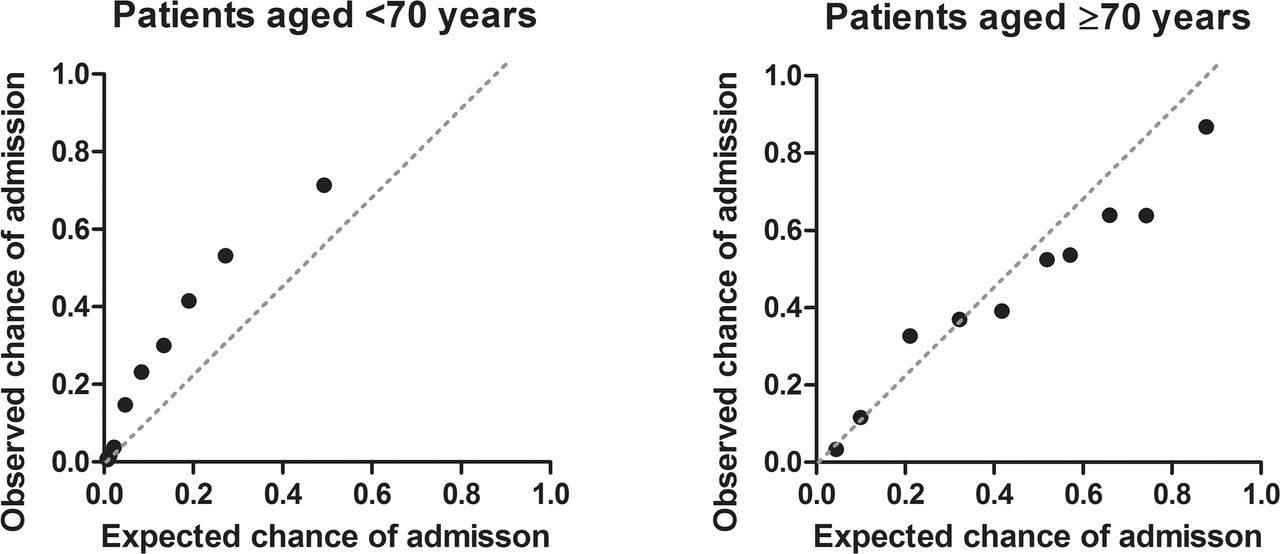
Calibration plot of expected and observed chance of admission for patients aged <70 and ≥70 years: validation cohort. Patients are divided into 10 equal groups to compare expected and observed chance of admission per group. Ideally the dots would be aligned across the grey striped line. ● Indicates decile of patient group.
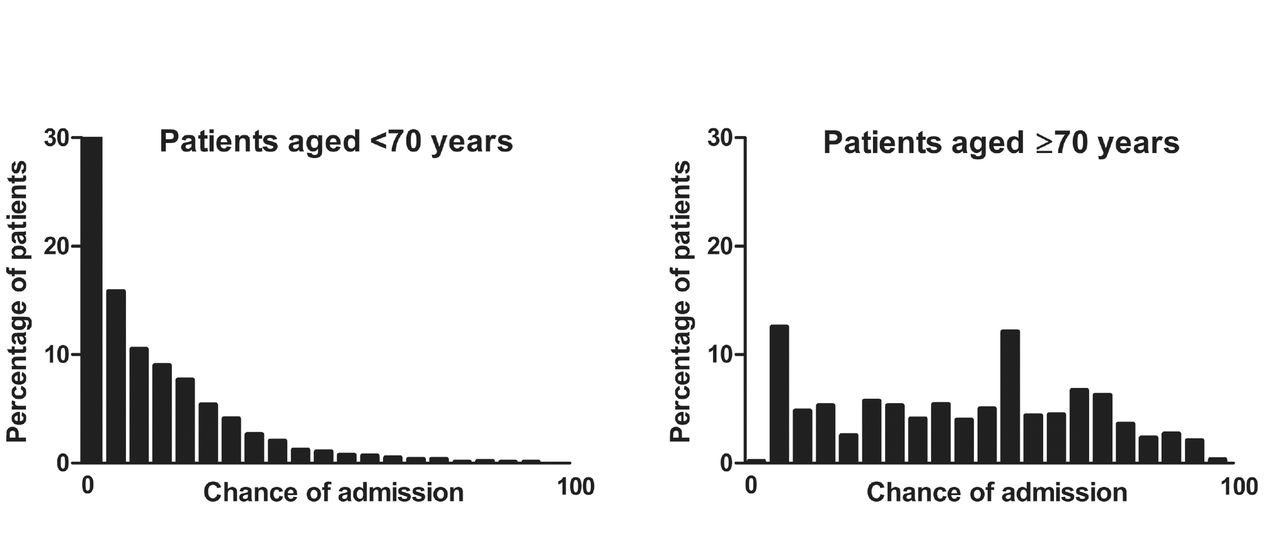
As shown in figure 3, there were more younger adult patients with a lower predicted chance of hospital admission in the validation cohort than for the older adult group. The predicted chance of hospital admission was also more equally distributed among the older patients. Table 4 depicts the test performance parameters of the models in predicting hospital admission by age group. Specificity, PPV and positive likelihood ratio (LR+) were higher in older patients. The prediction model shows superior predictive applicability than for example triage category alone.
Predictive applicability of prediction model in validation cohort
Distribution of chance of admission predicted by our model for patients aged <70 and ≥70 years: validation cohort. The x-axes are a scale of individually predicted chance of hospital admission, ranging from 0% to 100%. On the y-axes are the percentages of patients in the study with that individual risk.
Discussion
In this investigation, we found that routinely collected demographic and clinical patient data at ED triage can be used to predict hospital admission among ED patients. However, although the predictors of hospital admission are the same regardless of age groups, the strength of the relationships between patient demographic and clinical factors and hospital admission, as well as the performance of the predictive models, differ by age groups (<70 year old vs ≥70 years old). Overall predictive performance of the model was better for younger patients, although PPV was higher among older patients.
Our findings are in concordance with prior studies.7 9 10 14 20 Most of these variables, like triage category,13 chief complaint and abnormal vital signs,9 reflect illness severity at ED presentation. Sun et al 14 derived a prediction model for hospital admission in over 300 000 ED patients in Singapore. It was validated using split validation, and the model used age, race, arrival mode, triage category, preceding hospital admission or ED visit, and chronic conditions as predictors. The AUC of this model was 0.85, which is comparable with our findings. Cameron et al 7 created a similar prediction model in over 300 000 adult ED patients in Scotland. This prediction model used age, early warning score, triage category, referral and arrival mode, and preceding hospital admission within 1 year and found an AUC of 0.88. A model by Meisel et al 20 in the USA to predict hospital admission in the prehospital phase used age and chief complaint as predictors and found an AUC of 0.80. For all these studies, the investigators observed that age was an important factor in predicting hospital admission; however, they did not compare the predictive properties of disease severity between the younger and older patients. A prediction model for hospitalisation for ED patients in 4873 patients ≥75 years old by LaMantia et al 21 that included injury severity, HR, diastolic BP and patient chief complaint as predictors had an AUC of 0.73 (95% CI 0.69 to 0.76), with a sensitivity of 33%, specificity of 88% and LR of 2.75. Our model performed better, possibly due to inclusion of more demographic and clinical characteristics. Also sample size, differences in care system and selection of patients could have influenced the performance of the models. Physiology, polypharmacy and multimorbidity affect the measured vital signs of older patients, and some studies indicate that when relying solely on vital signs a proportion of severely ill older patients will be missed.12 To address this concern, we assessed whether the predictors of hospital admission are different for older as compared with younger adult ED patients. In our model for older patients, age was not a predictor. One explanation for this observation may be that by limiting the age range to those 70 years old and older to assess the predictive value of age, there was limited contrast in this population and hence a lack of power to detect differences by age. As an alternative explanation, among older patients disease severity and geriatric factors (eg, pre-existing functional or cognitive impairment) are more important than calendar age. As shown in table 2, there is no difference between median age for patients hospitalised or discharged in the older age group. For these reasons models that combine predictors of disease severity and geriatric factors may perform even better than ours, but such models do not exist yet.
In contrast to the prediction rule derived by Meisel et al, ‘chest pain’ as chief complaint was associated with a lower probability of hospital admission in our models for both older and younger patients. This observation could be explained by the care system in the region where the study was performed that patients with ST elevation myocardial infarction bypass this ED and go to the heart catheterisation laboratory immediately.22 Older patients with dyspnoea and syncope also had a decreased chance of hospital admission, which we explain by the fact that those patients with severe dyspnoea or who have not regained consciousness after syncope are triaged ‘red’ and were excluded from the study.
Although it was one of the important predictors of hospital admission in our models, there were missing values for vital signs in our study database. We believe that these values are missing because the triage nurse probably deemed vital signs registration unnecessary if the patient was not perceived ill. Using missing measurements of vital signs, such as the absence of measured BP, as valuable information in this study, seemed to be a marker of being less ill (table 3). Using the combination of predictors in this study into a prediction model successfully identified the 10% of the ED patient population with the highest risk of hospital admission, for both younger and older patients.
The prediction model for older patients had a lower AUC but higher PPV for this population. When predicting chance of hospital admission, one would want a high PPV. When designing an intervention based on such a prediction model, the patients with the highest risk should be targeted to prevent unnecessary and costly admissions. A low number of false-positives is therefore desirable.
Using the prediction model created in this study identifies the 10% of the ED patient population with the highest probability of hospital admission, with a PPV of 71% in the young and 81% in the old.
The PPV for hospital admission was higher in older than in younger patients, likely due to the higher a priori chance of hospital admission for older patients (derivation cohort: 23.1% admission rate in younger patients vs 43.2% for older patients; validation cohort: 24.1% admission rate in younger patients vs 44.4% in older patients). In addition, the LR+ was slightly better for older patients, which increases its clinical utility. Thus, this tool could trigger early awareness of the high chance of hospital admission, which could affect the clinical decision-making, preparation for admission, enhancement of ED work flow and shortened length of ED stay.
The overall discriminative performance of the model and OR of the individual predictors were significantly higher for younger patients. This observation could be explained by three different mechanisms. First, the relationship between vital signs and disease severity is likely to be different between younger and older patients. It is well known that with ageing the physiology of the body changes, with less homeostatic, respiratory and cardiovascular reserve. In combination with polypharmacy (eg, beta blockers), severely ill older patients show less prominent vital sign abnormalities. For example, in this study HR was an independent predictor for younger but not older patients. This finding was also shown in two recent studies in which normal vital signs proved to be less specific for the absence of severe illness for older adults.23 24 This phenomenon is not captured using standard MEWS cut-off points and could explain a part of the difference in discriminative power between models observed in this study.
Second, older patients with multiple comorbidities are often in a delicate equilibrium in which they can still function with relative independence and health. However, relative minor trauma or disease can disturb this equilibrium and result in severe illness and need for hospitalisation.25 The absence of comorbidities in our model and other or currently existing models could also explain the difference in the discriminative performance between the models for younger and older patients.10 11
Finally, older patients are sometimes hospitalised for their increased vulnerability rather than disease severity. For example, a patient with a small social network and low functional capabilities with the same minor trauma as a younger person would more easily be hospitalised. It has recently been shown that tools that exclusively use frailty to predict adverse outcomes in older patients, lack specificity and predictive capability.6 The fact that overall discriminative performance of our model for the older group was lower could be explained by the lack of information about conditions more prevalent among older patients, such as impaired cognitive function and functional status.
We therefore hypothesise that the combination of two dimensions—‘disease severity’ and ‘geriatric phenotypes’ such as multimorbidity and social, cognitive and physical function of the acutely presenting older patient—will result in an optimal model for prediction of adverse events and hospitalisation.
Strengths of this study are the large number of patients and events. These features enable better estimates of test performance parameters of the models. The clear and clinically relevant endpoint also is one of the strengths, as it is without bias whether a patient was admitted or not. The present study had several limitations. First, this was a retrospective study, which limits the ability to examine possible predictors that might have been obtained prospectively. There is also risk for information bias, although this was minimised by automatically harvesting data from the electronic patient files. Possible variables were selected based on earlier research, clinical judgement and availability in the ED records. The second threat was missing measurements of vital signs, for which we conceived a solution. The fact that a parameter was not measured in a specific patient was considered to contain information with respect to the indication to perform such a measurement and as such analysed alongside measured values rather than imputed. Third, there were no data available on geriatric phenotypes such as multimorbidity and social, cognitive and physical function, and also the comorbidities in young patients are lacking. While these factors could have an important impact on hospitalisation, it was possible to create a robust model with high specificity. Fourth, we used temporal validation to validate the model. Temporal factors could affect who was admitted, for example time of year and changes in admission over time. However, as a sensitivity analysis we performed the same study with a randomly selected split cohort and found similar results.
Finally, the admission rate in the current single-centre study may be different in other care systems, which influences its clinical applicability and PPVs of prediction models. While the prediction models have been created according to the recommendations by Stiell and Wells26 and have been internally validated using temporal data, it was not prospectively validated, evaluated in another patient population, implemented and disseminated, or analysed for cost-effectiveness because it is still in the early stages of development.
In summary, the composition of prediction models for hospital admission is similar for ED patients younger and older than 70 years old, although the AUC is higher in the model for younger patients, and the model for older patients showed a higher PPV and LR+. This retrospective study could help identify determinants of admission in older ED patients. Further research should investigate the combination of disease severity with frailty to improve prediction of hospital admission. We are currently performing a multicentre, prospective follow-up study (www.apop.eu)27 in which we will derive, validate and implement a prediction model according to internationally acknowledged recommendations26 to optimise care for this vulnerable patient group.
Acknowledgments
The authors would like to thank Mary Ann Etty (Department of Information Technology, Leiden University Medical Center, Leiden, The Netherlands) for her help in extracting the data from the medical records. Anton J M de Craen died on 17 January 2016.
References
Footnotes
Twitter Jacinta A Lucke APOPLeiden
Contributors SPM, GJB, CH, AJF and BdG designed the study. SPM and GJB obtained funding. JAL and JdG collected the data from the electronic patient files and JAL checked them for validity. AJMC provided statistical advice. JAL and FC performed the statistical analysis and drafted the paper. BdG and SPM advised during the drafting process. All authors contributed to its revision and gave approval of the final version of the article.
Funding The Institute for Evidence-Based Medicine in Old Age (IEMO) is funded by the Dutch Ministry of Health and Welfare and supported by ZonMW (project number 62700.3002). The funding organisation had no role in the design or conduct of the study, neither in the data collection and analyses nor in the interpretation of the data.
Competing interests None declared.
Provenance and peer review Not commissioned; externally peer reviewed.
Data sharing statement For collaboration purposes and data sharing, contact can be made with the corresponding author.