Article Text

Abstract
Objectives—The objectives of this project; (1) to evaluate the method, (2) to assess the information required for a more detailed model, and (3) to determine if it was worthwhile to undertake the data collection needed for a more detailed model.
Methods—A mathematical model was constructed using the operational research method of discreet event simulation. The effect of different SHO shift patterns on waiting time was assessed with the model.
Results—The model constructed was not an accurate representation of patient flow because of the large number of assumptions that had to be made in this preliminary model. However, the model predicted that an SHO shift pattern that more closely matched the patient arrival pattern would produce shorter waiting times.
Conclusions—This method can be applied to an accident and emergency department. Extension of this approach with the collection of additional data and the development of more sophisticated models seems worthwhile.
- patient flow
- mathematic model
Statistics from Altmetric.com
Movement of patients through an accident and emergency (A&E) department usually follows a number of well recognised patterns. The amount of staff time taken by each stage of a patient's movement through the A&E department and average waiting times at each point can be measured. If the time taken for each stage is known it should be possible to construct a mathematical model that represents the activity of the department.
Once such a model has been constructed it is theoretically possible to change various parameters (such as the number of patients or number of staff) and observe the effect of these changes on the rest of the mathematical model. A model that accurately reflected a real A&E department would allow an exploration of the effect of different configurations of service delivery without the large organisational changes that are required if changes are tried out in the real world.
This type of problem is common to many areas of industry, and the science of operational research1 has evolved to analyse the function of organisations and provide optimum solutions to problems. We have applied mathematical modelling techniques used in operational research to assess the effect of different SHO shift patterns on waiting times in an A&E department.
This pilot project was designed to construct a mathematical model of patient flow through an A&E department using existing information sources. The aims were; (1) to evaluate the method, (2) to assess the information required for a more detailed model, and (3) to determine if it seemed worthwhile to devote the considerable resources that would be required for the data collection needed to construct a more detailed model.
Method
The flow of patients through the A&E department was analysed and flow diagrams drawn for the possible pathways that a patient could follow. The arrival pattern of the patients and the number in each priority category were derived from historical records. The time spent for each activity (such as having a radiograph taken, having a history and examination performed or having a treatment) was derived either from historical data or estimates from A&E staff. Using discrete event simulation modelling2 (a standard operational research technique) a representation of real time patient flow was constructed using the SIMUL8 software package. This model was validated against patient waiting time data and optimised to reflect actual waiting times.
Two different shift patterns for SHOs were then used, with starting times either three hours earlier or three hours later than current shifts. It had been previously suggested that earlier shifts would give shorter waiting times.3 The model was re-run with each of these shift patterns and the predicted change in waiting times recorded.
The current proportion of patients seen within waiting time targets was derived from an independent report by the North Thames Audit department in 1997.3 This used local performance standards, which do not match the more recent recommendations of the UK National Triage Scale.
Results
An outline of the model derived from the analysis of patient flow patterns is shown in figure 1. The current SHO shift pattern (used in the initial model) and the two patterns tested (earlier and later) are shown in figure 2.

SIMUL8 model of the A&E department.

Average weekday patient arrivals per hour compared with current, earlier and later SHO shift patterns.
The predicted effect of the changes on waiting times against waiting time targets is shown in table 1. The earlier shift pattern gave a trend towards shorter waiting times. This was the expected trend, as compared with the current shift allocation (fig 3) the “earlier” pattern was a closer match to the arrival times of patients. Neither model is very close to the actual performance figures.
Performance of each model against audit standards

Current match between patient arrivals and SHO numbers.
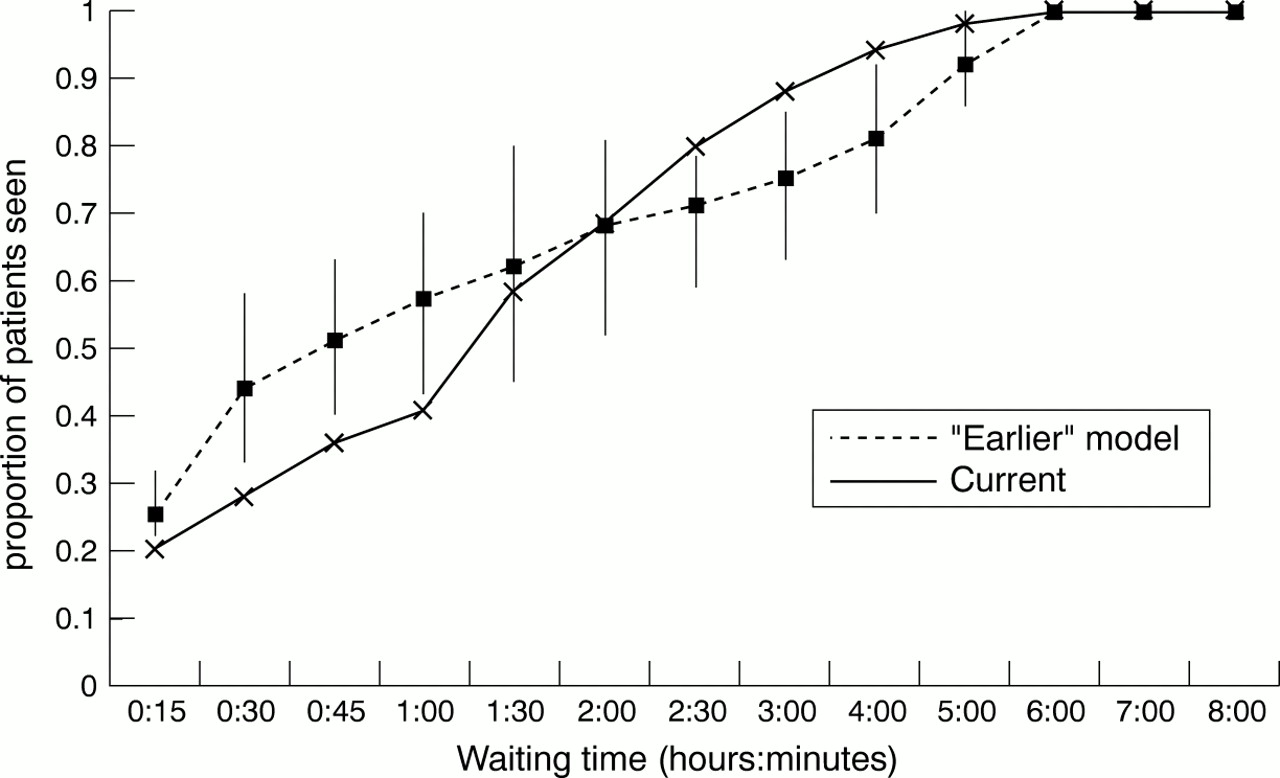
The mathematical model was optimised against the curve of time against number of patients waiting for each triage category. This means that picking a particular point in time (such as 60 minutes for Category 3 patients) is a particularly conservative way of assessing how good a fit there was between the model and reality. The actual effect on waiting time is better seen if the relation between time waited and proportion of patients seen is examined. For example, figure 4 shows that the mathematical model of the earlier shift pattern predicts that for this triage category significantly more patients will be seen within the first hour, but significantly more will have to wait for three or four hours. When modelling patient flow examination of curves in this way is more realistic than taking an arbitrary “performance target”.

Curve of overall waiting times for Category 3 patients using the “earlier” model (mean and 95% confidence intervals).
Discussion
The results of this study, concluding that an SHO shift pattern that best matches patient arrival gives shorter waiting times, are not surprising. However, the interest in this result is that the method gave a result that seems intuitively correct. The implication is that modelling of the activity of an A&E department may be a possible method for evaluating the probable effects of more subtle changes in service. This type of modelling has been applied to other areas of the Health Service,4, 5 but has not become generally used. The model constructed here was over-simplified, concentrating on the activity of SHOs and ignoring many of the areas that affect A&E waiting times. For example, the laboratories and the radiology department were simply treated as a “black box”, which processed the patient in a set time. In reality, of course, the time taken for an investigation varies depending on the workload, number of staff and demands from the rest of the hospital. Some important variables, such as the availability of a hospital bed, were completely ignored. A more complex model of an A&E department could be created to reflect these additional factors.
When the match between patient arrival and SHO number is examined (fig 2) it can be seen that there is a mismatch. The peak of patient arrival occurs before the peak of SHO availability. It could be predicted that earlier starts to the SHO shifts should result in shorter waiting times. This is exactly the trend found in the comparison of the “earlier” and “later” models.
A number of assumptions had to be made when constructing the model. Some of the required information was readily available from existing information systems (such as the number of patients in each triage category arriving at each hour of the day). Estimates had to be made of a number of factors. For example, the time spent by a doctor with each patient is not readily available from existing information systems, but is crucial in the construction of the mathematical model. The construction of this initial model has highlighted the additional information that would be required if a more realistic model was to be constructed.
In operational research terms this was seen as a fairly straightforward problem, with the model being constructed using standard methods (discrete event simulation). The development of this type of computer modelling may be a useful tool when determining how to gain the most from scarce resources. A model could be used either to review current resource allocation or to decide on priorities for the allocation of new resources. When additional funding is made available, for example in the allocation of “winter pressure” money to the Health Service, there is often a bidding process in which the effect of each bid is difficult to predict. A mathematical model could make this process more scientific.
As mentioned in the Results section there is a potential conflict that needs to be resolved when considering the evaluation of future models. Should the objective be to produce the best performance against waiting time targets or to produce the shortest overall waiting times? Waiting time targets are by definition arbitrary. If evaluated against a particular performance target (whether the local targets used in this study or the more recent BAEM recommendations) the best mathematical model would be produced if any patient who waited longer than the waiting time target was put to the back of the queue, so preventing other patients from going over the target time! This might look good on paper, but may not be the best solution. In future work there must be a very specific resolution of this problem.
The models constructed here did not provide a good description of waiting times in all categories. However, given the availability of data and the number of assumptions, a good model was unlikely to result for this initial study. The finding that a fair model (one that produced the results that would have been intuitively expected) can be produced should encourage further development of this approach. The next stage is the collection of hard data to replace the variables that were estimated and put some detail into the grossly over-simplified “black boxes” that were used for investigations in this study. This will require significant funding, with a full time data collector, a full time operational research specialist to develop the model, and a considerable amount of statistical expertise to evaluate the model produced.
In conclusion, operational research methods can be applied to model patient movement through an A&E department. This computer model constructed in this initial study has been over-simplified, so cannot reflect the complexity of real patient flows. However, this study has shown that even a simple model may predict different flows if a factor, such as SHO shift patterns, is changed. More sophisticated models, taking account of other factors that influence patient flow, might be used to assist decisions about the most effective use of resources.
Acknowledgments
Contributors
Tim Coats initiated this study, formulated the study questions, coordinated data collection and wrote the paper. Stephanos Michalis helped formulate the study questions, constructed the mathematical models and wrote up the project for an MSc thesis in Operational Research. Alan Cox gave additional advice about the methods. The guarantor of the paper is Tim Coats.