Article Text

Abstract
Objectives: To describe changes in the case mix, demographics, waiting times (WTs; time from arrival in the emergency department (ED) until seen by a clinician) and treatment times (TTs; time from seeing a clinician until leaving the ED) of adult patients presenting to the EDs in Sheffield, UK, between 1993 and 2003.
Design: A retrospective analysis of routinely collected data.
Results: Of a total of 252 156 patients included in the study, the proportion of attendees aged 16–29 years decreased from 38.7% in 1993 to 28.8% in 2003 (rate of change (b) = −1.10% per year, 95% CI −1.20% to −0.82%, p<0.001) whereas the proportion aged 80–99 years increased from 6.2% to 10.4% (b = 0.37% per year, 95% CI 0.29% to 0.45%, p<0.001). The proportion of “minors” (patients not arriving by ambulance and subsequently discharged) fell from 71.1% in 1993 to 60.8% in 2003 (b = −1.04% per year, 95% CI −1.36% to −0.73%, p<0.001). WTs increased from a median of 21 minutes in 1993 to 48 minutes in 2003 (b = 3.5 min per year, 95% CI 2.23 min to 4.77 min, p<0.001). The median TT for minors was unchanged but that for majors (patients arriving by ambulance and admitted to hospital from the ED) increased from 55 to 205 minutes (b = 11.55 min per year, 95% CI 6.54 min to 16.55 mins, p = 0.01).
Conclusion: The demographics, case mix, and waiting times of patients presenting to EDs in Sheffield changed considerably over an 11 year period. There is evidence that the service for minor case patients improved slightly at the end of the period studied, but this is possibly at the expense of a deteriorating experience for major case patients.
- DMC, decision making clinician
- ED, emergency department
- TT, treatment time
- WT, waiting time
- emergency department
- performance
- waiting times
Statistics from Altmetric.com
A key target for acute National Health Service (NHS) trusts in the UK at present is improving waiting times (the time from arrival in the emergency department until seen by a clinician) in emergency departments (EDs).1The NHS Plan set a target such that by 2004 no one should wait more than four hours from arrival in the ED to admission, discharge, or transfer.2 The government envisaged that this would reduce average waiting time in EDs to 75 minutes. Some progress has been made by the sustained investment in new staff and new ways of working. Figures published by the Department of Health show that the proportion of patients spending less than four hours in the ED improved from 77% in the second quarter of the 2002–03 financial year to 88.1% in the same period in 2003–04.3 Further improvements are going to be challenging and if these are to be achieved, a detailed understanding of the demographics, case mix, and waiting times of patients attending EDs is required. There is growing evidence that the major determinant of ED efficiency is the time that patients have to wait for admission to a hospital bed and that this in turn is determined by the level of bed occupancy.4–8 We have been aware of a deterioration in waiting times in our service over the past 10 years. There are several possible explanations but we hypothesise that a change in case mix, with more patients requiring admission, more elderly patients with complex problems, and delays in moving patients from the ED to inpatient beds, might explain the problem.
This paper aims to describe changes in the case mix, demographics, and waiting times of patients over the age of 16 years presenting to EDs in one city in England over an 11 year period, from 1993 to 2003.
METHOD
We undertook a retrospective study of routinely collected data from the EDs in Sheffield, a large city in the north of England. At the start of the study period Sheffield had two EDs, based at the Royal Hallamshire (RHH) and Northern General (NGH) hospitals, which served the adult population and a paediatric ED based at Sheffield Children’s Hospital (SCH). These services were reconfigured in 1997 to leave one major adult ED based at the NGH, a nurse led minor injuries unit at the RHH and a paediatric ED at SCH. This reconfiguration has been described in detail elsewhere and has not been shown to have caused any deterioration in ED performance.9
For the period 6 April to 5 July for each year from 1993 to 2003 we retrieved information regarding all ED episodes from the ED database. We chose this time period to avoid the times when junior medical staff in the ED rotate into new posts and thus have hopefully avoided any variation resulting from the induction of new staff into the department. We included all new ED episodes either if the patient was aged over 16 years at the time of presentation or if no age was recorded and the patient presented to the ED at the RHH or NGH. We considered as new episodes all episodes that were neither planned nor unplanned follow up episodes from a previous attendance at the EDs under investigation. Data retrieved included the ED booking-in time, time seen by a decision making clinician (DMC) and time leaving the ED, as well information regarding date of birth, method of arrival, presenting complaint, and disposal.
The DMC could be either a doctor or an emergency nurse practitioner. The ED booking-in time is recorded automatically when a patient registers at the ED. The time seen by a clinician and the time leaving the ED are recorded in the patient’s ED notes and these times are then routinely entered into the ED database once the episode is concluded.
For each episode we calculated the patient’s age at presentation. We defined the waiting time (WT) as the time taken from arrival in the ED until the patient was seen by a DMC. Where the WT exceeded 12 hours a null value was recorded as WTs of this length had never occurred in the ED and were therefore most likely to represent errors in the recording of such information at the time of the episode. Similarly, we defined treatment time (TT) as the time from seeing a DMC until the patient left the ED. Null values where recorded where the TT exceeded 24 hours. To identify differences in the WT and TT for patients with different urgencies of presenting complaint we divided the patients into two groups. The “minors” group consisted of those patients who did not arrive by emergency ambulance and were subsequently discharged from the ED. Conversely, the “majors” group consisted of those patients who arrived by emergency ambulance and were admitted to hospital from the ED. We chose these definitions because we thought they would provide the greatest consistency year on year.
For each year we calculated the percentage of patients waiting less than one hour to see a DMC and the percentage of admitted patients spending less than four hours in the ED to allow comparison with figures published by the Audit Commission.1
In keeping with local policy, we did not consider it necessary to obtain ethical committee approval for this study as it involved only routinely collected data.
Data analysis
We analysed the data with Access 2000 (Microsoft Corporation, Redmond WA) and SPSS for Windows 11.5 (SPSS Inc, Chicago, IL). Median and ninetieth percentile values were calculated for the WT and TT for each year. We used linear regression to analyse differences in the rate of increase of ED attendances in Sheffield compared with changes occurring throughout England. We analysed changes in demographics and case mix over time using linear regression to determine their significance. Changes in the median WT and TT were also examined using linear regression to determine if these were related to year of presentation or clinical group (major/minor). For subjects with complete and incomplete WT and TT data the difference in mean age between these groups was assessed using Student’s t test. We assessed the differences between these groups regarding the proportion of men, proportion of major cases, and proportion presenting as a result of trauma with the χ2 test.
We excluded episodes with missing variables from each linear regression model where the missing data referred to the variable being tested. Patients were not completely removed from the analysis due to missing data and no attempt was made to extrapolate values for missing variables.
To investigate the trends in median waiting times over the 11 year study period and to correct for differences in age, sex, and the proportions presenting with trauma in each year we used a two stage linear regression procedure. In the first stage, the individual patient’s age, sex, and whether or not they were presenting with trauma, were regressed on the patient’s original WT (or TT) and then the median unstandardised residuals for each year were calculated. The second stage then used this median residual as the dependent variable, and linear regression was again used to assess if WT (or TT) was related to year of attendance. This two stage procedure had the effect of adjusting the median waiting for any differences in age, sex, and type of trauma over the study period, and still allowed us to use the more appropriate median WT (rather than the mean) as our outcome measure.
The regression coefficient “b” represents the rate of change in the parameter estimate (for example median waiting time) over the 11 year time period.
RESULTS
During the period studied there were 252 156 new patient episodes. The average increase in total attendances in Sheffield during the period studied was 1.3% (n = 969 attendances) per annum (95% confidence interval (CI) −4.2% to 6.8%). This is smaller than the average annual increase nationally of 1.7% (n = 0.2 million attendances) per annum.10 Considering the annual percentage change in Sheffield and that in England together, linear regression demonstrates that the percentage change each year was related neither to year of attendance (b = −0.6%, 95% CI −0.91% to 0.79%, p = 0.88) nor to site (Sheffield or England) (b = 0.86%, 95% CI −4.03% to 5.74%, p = 0.72). This showed that is there had been no significant alteration in the percentage change in attendances each year and no difference between the rate of increase in Sheffield and England.
Patient age
The age profile changed, with the proportion of attendees aged 16–29 years falling from 38.7% (n = 9089) in 1993 to 28.8% (n = 7775) in 2003 (b = −1.10%, 95% CI −1.20% to −0.82%, p<0.001). There was a corresponding increase in the proportion of patients in older age groups, most notably in those aged 80–99 years of age; this age group accounting for 6.2% (n = 1437) of attendances in 1993 and 10.4% (n = 2695) in 2003 (b = 0.37%, 95% CI 0.29% to 0.45%, p<0.001).
Presenting complaint
The proportion of new patients arriving by emergency ambulance increased from 22.7% (n = 5080) in 1993 to a peak of 31.6% (n = 7838) in 2002 (b = 0.93%, 95% CI 0.62% to 1.24%, p<0.001). The reasons patients attend an ED can be broadly divided into problems arising due to trauma and those due to other causes. Trauma was responsible for the majority of attendances in the study, accounting for a maximum of 59.4% (n = 11 599) of episodes in 1997 and falling to 52.9% (n = 13 144) in 2003 (b = −0.46%, 95% CI −8.7% to −0.04%, p = 0.04). This pattern was apparent in all age groups but was most marked among older patients.
The proportion of cases defined as “minor” fell from 71.1% (n = 15 945) in 1993 to 60.8% (n = 15 096) in 2003 (b = −1.04%, 95% CI −1.36% to −0.73%, p<0.001). Correspondingly “major” cases accounted for 9.2% (n = 2052) of episodes in 1993 increasing to 14.0% (n = 3482) in 2003 (b = 0.53%, 95% CI 0.30% to 0.76%, p = 0.01).
Missing waiting time and treatment time data
Patients with complete data for WT and TT accounted for 84.8% (n = 213 911) of the sample studied. The mean age of patients with complete data was 44.4 years compared to 41.5 years for patients with incomplete data (WT or TT missing) and this difference was statistically significant (t = 25.09, df = 53911.8, p<0.001). The differences between these groups with regard to the proportion of men, cases resulting from trauma, and proportion of major cases are shown in table 1.
Comparison of percentage of men, major cases, and cases due to trauma for patients with complete and incomplete WT and TT data
Waiting time
Waiting times altered considerably, with a median of 21 minutes and ninetieth percentile WT of 83 minutes in 1993, rising to 48 and 165 minutes, respectively in 2003 (b = 3.5 min, 95% CI 2.23 min to 4.77 min, p<0.001). Figure 1 demonstrates change in the median WT for minor and major cases. In 1993 the median WT for a minor was 24 minutes and for a major was 19 minutes. In 2003 this pattern was reversed, with the median WT increasing to 40 and 58 minutes, respectively, for minor and major cases. Correcting for changes in age, sex, and the proportion of patients presenting as a result of trauma, linear regression demonstrates that changes in median WT are related to year of attendance (b = 3.41 min, 95% CI 2.60 to 4.23, p = <0.001) but not to clinical group—that is, major or minor (b = 0.43 min, 95% CI −10.89 to 11.74, p = 0.94).

Changes in median waiting time (WT). Vertical bars represent the interquartile range of WTs. Minors: patients who did not arrive by emergency ambulance and were subsequently discharged from the ED; majors: patients who arrived by emergency ambulance and were admitted to hospital from the ED.
Treatment time
The distribution of TT also changed markedly. The median TT in 1993 was 30 minutes with a ninetieth percentile TT of 90 minutes. In 2003 these parameters had both increased with a median TT of 45 minutes but most notably a ninetieth percentile TT of 242 minutes (b = 0.96 min, 95% CI 0.33 min to 1.60 min, p = 0.007). The median TT for major and minor cases differed. Figure 2 demonstrates that the median TT for minors changed little from 1993 to 2003, varying between 25 and 34 minutes. In contrast the median TT for majors almost quadrupled from 55 minutes in 1993 to 205 minutes in 2003.
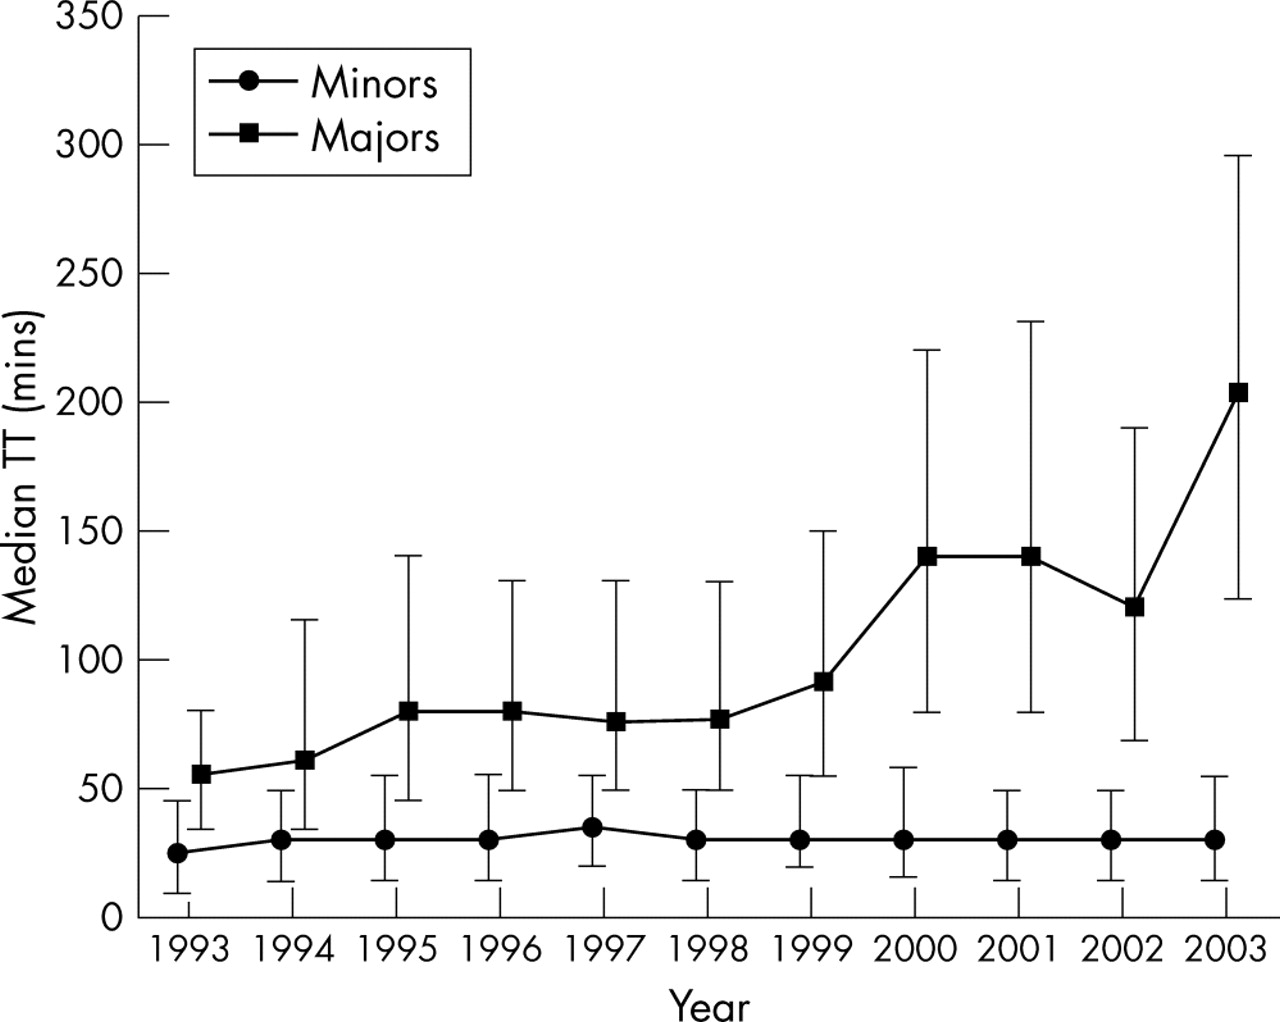
Changes in median treatment time (TT). Vertical bars represent the interquartile range of TTs. Minors: patients who did not arrive by emergency ambulance and were subsequently discharged from the ED; majors: patients who arrived by emergency ambulance and were admitted to hospital from the ED.
Correcting for changes in age, sex, and the proportion of patients presenting as a result of trauma, linear regression shows that for minor cases median TT was not related to year of attendance (b = 0.13 min, 95% CI −0.38 min to 0.65 min, p = 0.58) but a relation between median TT and year did exist for major cases (b = 11.46 min, 95% CI 6.68 min to 16.24 min, p<0.001).
Outcome
The disposition of patients from the ED is shown in table 2. The number of patients admitted to hospital during the three month period studied for each year increased from 3358 (15.0%) in 1993 to 5629 (22.7%) in 2003 (b = 0.64%, 95% CI 0.38% to 0.89%, p<0.001).
Disposal from the ED. Per cent of total new attendances in parentheses
Resources available
The numbers of medical staff and emergency nurse practitioners working in the EDs in Sheffield in 1993 and 2003 are shown in table 3. The number of acute hospital beds available in Sheffield fell from 2900 in 1993 to 2074 in 2003.
Changes in ED staffing. (Staffing figures shown are for numbers of whole time equivalents unless stated otherwise)
Comparison with the findings of the Audit Commission
Our study showed that the percentage of patients seeing a DMC within one hour of arrival (PC1) fell from 75.2% in 1996 to 56.4% in 2003. The percentage of admitted patients admitted within four hours of arrival (PC4) declined from 88.2% to 64.1% over the same time period. Figure 3 shows how these changes compare to changes in the median PC1 and PC4 found by the Audit Commission in their reviews of EDs in England and Wales.1

Changes in the percentage of patients waiting less than one hour to be seen (PC1) and the percentage of admitted patients admitted within four hours (PC4) for patients included in this study (Sheffield PC1 and PC4) compared to the findings of the Audit Commission (Audit commission PC1 And PC4). PC1: patient seen by a DMC within one hour of arrival; PC4: admitted patient admitted within four hours of arrival.
DISCUSSION
The above findings demonstrate that there were significant changes in the demographics and case mix of patients attending the EDs in Sheffield from 1993 to 2003. Marked changes also occurred in both the WTs and TTs. WTs increased for both minor and major patients but only recently has the median WT for a minor case been less than that for a major. In the UK, a number of strategies have been implemented nationally to improve WT for minors, including the establishment of separate minor injury units and “streaming” of minor cases.11,12 A separate minor injury unit has been present in Sheffield since 1997 and in 2003 a separate stream for minor injuries has been in operation part time in the ED of the NGH. It would appear that these services are beginning to have a significant impact upon the service for ‘minors’ in Sheffield. Although it may appear unethical and lacking in good clinical sense that minors are being seen quicker than major cases, the improvement is probably due mainly to the use of new money to employ minor injury emergency nurse practitioners. The result is that it appears that WTs, at least for minors, are beginning to fall.
The median TT for minor injuries remained static over the period studied whereas that for majors increased considerably. As far as we are aware this finding has not been previously demonstrated. The service received by minor cases will be predominantly under the control of the ED, with little recourse to other specialties or specialised diagnostic services in most cases. This may not be the case for major cases. It was not possible in this study to determine what events occurred during the TT. Further work would obviously be vital to determine why the TT of major patients has increased so greatly. This time period will include the time taken to assess the patient by the ED clinician and obtain any necessary investigations, as well as the time from referral to transfer to an inpatient bed. Whatever the cause, the service received by major cases continues to deteriorate at an alarming rate.
The numbers of patients attending the ED is increasing, but the proportion of the patients subsequently discharged has fallen considerably. If the figures presented above are extrapolated to an entire year’s ED attendances in Sheffield, an extra 9000 adult patients per annum are being admitted to hospital from the ED, whereas the number of acute hospital beds fell during the study period from 2900 to 2074. Possibly of greater importance is the fact that the majority of these patients are now being admitted to one hospital rather than ED admissions being distributed across two hospitals, as was the case prior to the reorganisation of services in 1997. These changes may account in part for the increase in TT for major patients if inpatient beds are not available to receive such patients from the ED.
It is difficult to interpret how the changes in staffing have influenced the findings presented here. Although numbers of staff have increased, particularly provision of emergency nurse practitioners, the service provided has altered considerably.
Our aim in the present study was to describe the changes that have occurred. To make inferences about causation is beyond the scope of this paper and would not be possible with the data collected.
The study has some weaknesses. The data were retrospective but data collection has been one of the major objectives of the Sheffield emergency service and steps were taken to ensure common data collection practices across all sites, such as the training of medical and nursing staff in the recording of data and training of administrative staff in data entry. Sheffield has also had a major change in its services during this period. However this change was subject to a rigorous prospective audit of waiting and admission times.9 We did not detect any deterioration in these measures, indeed there was a slight improvement. The Audit Commission has examined WTs in other EDs in the UK and found a similar deterioration in the majority of departments.1 It has also demonstrated a decrease in the proportion of patients admitted within four hours of arrival over time. The Audit Commission’s findings are based on data collected since 1996. Our findings, presented above, would suggest the changes in Sheffield are not unique or isolated. The deterioration in WTs in Sheffield would appear to mirror changes throughout England and Wales. It also appears that many EDs in other countries are experiencing similar problems.13,14
CONCLUSION
We have confirmed that WTs and TTs in Sheffield have deteriorated over the past 10 years. Recent innovation and investment is showing improvement for “minor cases”. The TTs for major cases have increased markedly probably due to an increase in the volume of elderly patients and numbers of patients requiring admission. We postulate that a change in the way illness is dealt with in the community is resulting in more patients being brought to hospital and admitted. If the UK government wishes to hit the targets for emergency care then it must concentrate on emergency primary care. However, the recent changes to the General Medical Services contract and the withdrawal of many general practitioners from emergency primary care make it difficult to envisage how this will be achieved.
CONTRIBUTORS
TL, JW, and SM conceived the study. TL and SW performed the analysis. All authors contributed to the writing and editing of the manuscript. TL is the guarantor.
Footnotes
-
This study was conducted as part of a study funded by the National Co-ordinating Centre for NHS Service Delivery and Organisation Research and Development (SDO). The views expressed are those of the authors and not necessarily those of the funding body.
-
Competing interests: At the time of submission/acceptance of this paper J Wardrope was an editor of this journal.
Linked Articles
- Primary Survey