Article Text

Abstract
Background: The Rapid Acute Physiology Score (RAPS) and Rapid Emergency Medicine Score (REMS) are risk adjustment methods for emergency medical admissions developed for use in audit, research, and clinical practice. Each predicts in hospital mortality using four (RAPS) or six (REMS) variables that can be easily recorded at presentation. We aimed to evaluate the predictive value of REMS, RAPS, and their constituent variables.
Methods: Age, heart rate, respiratory rate, blood pressure, Glasgow Coma Score (GCS) and oxygen saturation were recorded for 5583 patients who were transported by emergency ambulance, admitted to hospital and then followed up to determine in hospital mortality. The discriminant power of each variable, RAPS, and REMS were compared using the area under the receiver operator characteristic curve (AROCC). Multivariate analysis was used to identify which variables were independent predictors of mortality.
Results: REMS (AROCC 0.74; 95% CI 0.70 to 0.78) was superior to RAPS (AROCC 0.64; 95% CI 0.59 to 0.69) as a predictor of in hospital mortality. Although all the variables, except blood pressure, were associated with mortality, multivariate analysis showed that only age (odds ratio 1.74, p<0.001), GCS (2.10, p<0.001), and oxygen saturation (OR 1.36, p = 0.01) were independent predictors. A combination of age, oxygen saturation, and GCS (AROCC 0.80, 95% CI 0.77 to 0.83) was superior to REMS in our population.
Conclusion: REMS is a better predictor of mortality in emergency medical admissions than RAPS. Age, GCS, and oxygen saturation appear to be the most useful predictor variables. Inclusion of other variables in risk adjustment scores, particularly blood pressure, may reduce their value.
- APACHE, Acute Physiology and Chronic Health Evaluation
- AROCC, area under the receiver operator characteristic curve
- ED, emergency department
- GCS, Glasgow Coma Score
- RAPS, Rapid Acute Physiology Score
- REMS, Rapid Emergency Medicine Score
- emergency care
- risk stratification
- mortality
- prediction
Statistics from Altmetric.com
- APACHE, Acute Physiology and Chronic Health Evaluation
- AROCC, area under the receiver operator characteristic curve
- ED, emergency department
- GCS, Glasgow Coma Score
- RAPS, Rapid Acute Physiology Score
- REMS, Rapid Emergency Medicine Score
Risk stratification scores have been developed for many groups of patients, such as those with major trauma,1 critical illness,2 and acute coronary syndrome.3 These have played an important role in improving care, by providing risk adjusted estimates of mortality for research, audit, and clinical care.4 An ideal risk adjustment score for emergency care would use a limited number of variables that can be easily collected at presentation, to provide an accurate prediction of a clinically important outcome such as mortality.
Emergency medical admissions constitute a substantial proportion of the workload of the emergency department (ED).5 Mortality among these patients is significant and may be determined by the quality of care provided,6 yet any non-randomised comparison of mortality should take into account differences in case mix. A risk stratification score for emergency medical admissions is therefore required to allow estimates of mortality to be routinely adjusted for case mix.
Although risk stratification methods have been developed for selected groups of emergency patients,7 there have been few attempts to develop a generic risk adjustment score for emergency medical admissions.8,9,10,11 The Rapid Acute Physiology Score (RAPS)8 was developed from the Acute Physiology and Chronic Health Evaluation II (APACHE II)2 to predict in hospital mortality, using only those variables in APACHE II that are likely to be regularly recorded in emergency medical admissions: heart rate, blood pressure, respiratory rate, and Glasgow Coma Score (GCS). A recent modification of RAPS, the Rapid Emergency Medicine Score (REMS),9–11 has added oxygen saturation and age to these four variables. Comparison of REMS and RAPS suggested that REMS is superior to RAPS in predicting in hospital mortality. However, this comparison was undertaken in the single centre in which REMS was developed and needs to be confirmed in other settings.
We aimed to: (a) compare RAPS and REMS in a large population of emergency medical admissions, (b) evaluate the predictive power of each constituent element of RAPS and REMS, and (c) explore the potential for modifications to these scores to improve predictive power.
METHODS
We undertook a secondary analysis of a large database of patients brought to the ED after being attended by an emergency ambulance. The original study was planned to evaluate the impact of performance targets upon patient outcomes. For a specified time period during each year (from 1996/7 to 2000/1) we sampled consecutive, life threatening category A emergency ambulance calls from four ambulance services: Royal Berkshire, Derbyshire, Essex and West Midlands. “Life threatening” was defined as being any case in which the caller reported that the patient had chest pain, was unconscious, or was not breathing. All calls where an ambulance arrived at scene and treated or transported a patient were included in the study. Ethics approval was provided by local research ethics committees.
These cohorts of patients were followed up to discharge from hospital. Research staff recorded presenting features from the ambulance patient report form, and then reviewed ED and inpatient notes to determine patient characteristics, clinical conditions, processes of care and outcome, up to hospital discharge or death. The ambulance patient report form was completed on scene and in transit by the paramedic or technician. The first recorded parameter was used in each case. Research staff allocated a clinical code to each patient from a pre-specified list, based on the information collected. No clinical code could be identified for a proportion of cases where the patient was lost to follow up, there was no record of their being treated at hospital, or their notes could not be retrieved.
In total, 17 950 cases were recorded in the original study. For this study, we excluded the following patient groups: (a) patients clinically coded as having injury, mental illness, or cardiac arrest, and those with no clinical code recorded; and (b) patients who were not transported to hospital, died at the scene, were dead on arrival at hospital, or were discharged from the ED, and those whose outcome was not recorded. The study population for this analysis therefore included patients who were admitted to hospital or died in the ED.
Data analysis
Table 1 shows how RAPS and REMS are calculated from their constituent variables. Each variable is converted to a score, with zero being the lowest risk, and each increment in the score representing an increased risk. The individual elements of each score are summed to give the overall score. RAPS has four variables, each with a maximum score of 4, so the maximum RAPS score is 16. REMS has six variables and a maximum score of 26. Both scores originally used mean arterial pressure, whereas in our database only systolic blood pressure was recorded. We therefore adjusted the scoring procedure to allow for this difference. All other variables were scored in the same way as previous studies.
The scoring system used for RAPS and REMS
As both scores have multiple points, they therefore have multiple potential thresholds for decision making. Using a low threshold to predict mortality will have a relatively high sensitivity but low specificity, whereas using a high threshold will have high specificity, but low sensitivity. We therefore used receiver operator characteristic (ROC) curves to compare the discriminatory power of the scores. For each score the true positive rate (sensitivity) was plotted against the false positive rate (1 minus specificity) for each potential threshold of the score. The area under the receiver operator characteristic curve (AROCC) was then calculated to provide an estimate of the predictive power of the score over its’ entire range of values.
To evaluate the predictive power of each of the constituent elements of RAPS and REMS, we first undertook univariate analysis, using logistic regression to estimate the association between the score for the variable concerned and in hospital mortality. We then undertook multivariate analysis to determine which individual variable scores were independent predictors of mortality. All six predictor variable scores were entered into a logistic regression model, with in hospital mortality as the outcome. Odds ratios with 95% confidence interval (CI) were calculated. A p value <0.05 was considered significant. In all these analyses, we used the variables as they are categorised in table 1, rather than the raw data. Finally, we created a new score using only the individual variable scores shown to be independent predictors of mortality.
RESULTS
Of the 17 950 patients in the database, 1105 were clinically coded as cardiac arrest, 287 as mental health problems, 927 as injury, and 3448 had no clinical code. The patients without a clinical code had a mean age of 48.4 years, 45.8% were female, and 3.9% died. Of the 12 183 remaining patients, 914 were not transported to hospital, 857 died at the scene, 31 were dead on arrival at hospital, 3963 were discharged from the ED, and 835 had no outcome recorded. Thus, there were 5583 patients who were either admitted or died in the ED. The study population had a mean age of 63.4 years and 2350 were female (42.3%). Table 2 shows their clinical codes. There were 711 in hospital deaths (12.7%); 109 in the ED and 602 after hospital admission.
Clinical codes of patients in the database
There were varying rates of missing data among the predictor variables. Age was recorded for 5356 (95.9%) patients, heart rate for 4668 (83.6%), blood pressure for 3967 (71.1%), respiratory rate for 4459 (79.9%), GCS for 4784 (85.7), and oxygen saturation for 2870 (51.4%). This meant that RAPS could be calculated for 3624 patients (64.9%), while REMS could be calculated for only 2215 (39.7%). Table 3 compares the characteristics of patients for whom RAPS and REMS could be calculated to the characteristics of the overall population.
Characteristics of patients with sufficient data to calculate RAPS and REMS, compared to the whole cohort
We compared REMS and RAPS using only the patients for whom there was sufficient data to calculate both scores. The AROCC for RAPS was 0.64 (95% CI 0.59 to 0.69, p<0.001), whereas the AROCC for REMS was 0.74 (95% CI 0.70 to 0.78, p<0.001), indicating that REMS had better discriminatory power than RAPS in these patients.
Univariate analysis showed that all of the individual variables with the exception of systolic blood pressure were associated with in hospital mortality. The unadjusted odds ratio for age was 1.50 (95% CI 1.42 to 1.59, p<0.001), for heart rate 1.17 (1.09 to 1.26, p<0.001), for respiratory rate 1.81 (1.68 to 1.95,p<0.001), for GCS 1.94 (1.83 to 2.05), for oxygen saturation 1.85 (1.64 to 2.09), and for systolic blood pressure 0.95 (0.89 to 1.02, p = 0.172).
Multivariate analysis showed that GCS (adjusted odds ratio 2.10; 95% CI 1.86 to 2.38; p<0.001), age (1.74; 1.52 to 1.98; p<0.001), and oxygen saturation (1.36; 1.13 to 1.64; p = 0.001) were independent predictors of mortality. After adjusting for other variables, heart rate (1.01; 0.88 to 1.17; p = 0.852) and respiratory rate (1.15; 0.924 to 1.42; p = 0.214) did not predict mortality, while systolic blood pressure (0.88; 0.78 to 0.98; p = 0.025) appeared to have a weak inverse relationship with mortality.
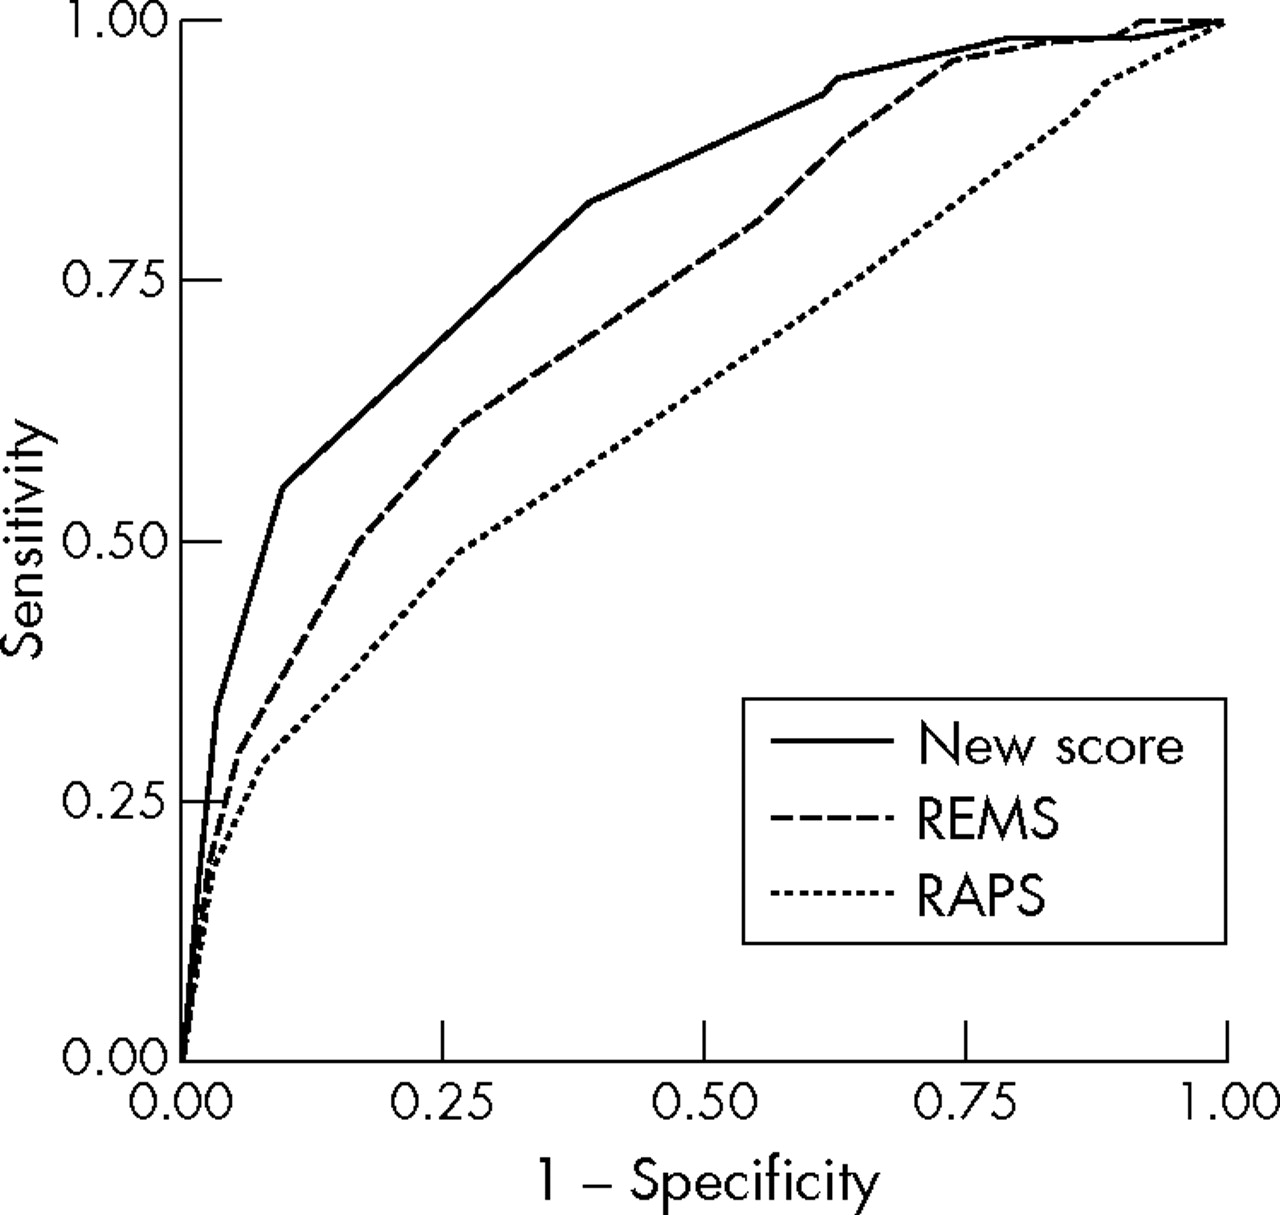
On the basis of the results of multivariate analysis we created a new score that only used the scores for GCS, age, and oxygen saturation. This score could be calculated for 2743 patients (49.1%). The area under the curve for this score was 0.81 (95% CI, 0.78 to 0.84, p<0.001). The receiver operator characteristic curves for RAPS, REMS, and our new score are shown in fig 1.
Receiver operator characteristic curves for RAPS, REMS and a new score based on GCS, age, and oxygen saturation.
DISCUSSION
This study has confirmed that REMS provides better discriminatory power for in hospital mortality than RAPS. However, we also found that, among the constituent elements of REMS, only age, GCS, and oxygen saturation were independent predictors of mortality. Heart rate and respiratory rate were associated with mortality on univariate analysis, but this association was not significant when age, GCS, and oxygen saturation were taken into account. Systolic blood pressure did not show an association with mortality even on univariate analysis. Based on these findings, we created a model consisting of age, GCS, and oxygen saturation. This model had better discriminatory power than either REMS or RAPS in our population.
Olson et al used similar methods to derive REMS and evaluate the predictive power of RAPS. They found that REMS was a better predictor of in hospital mortality than RAPS. Their estimate of the AROCC for RAPS (0.65) was very similar to ours (0.64), but their estimate for REMS (0.85) was markedly higher (0.74). This may be explained by the observation that RAPS was originally derived in a separate study, while REMS was derived within the Olson study, and risk stratification tools generally perform better in the population in which they are derived. Our result may provide a better estimate of how REMS performs in a validation study.
Olson found that all six constituent elements of REMS were associated with in hospital mortality, but the association between mean arterial pressure and mortality was not significant on multivariate analysis. This suggests, along with our findings, that blood pressure is not a useful predictor of mortality. Unlike ours, heart rate and respiratory rate were independent predictors of mortality in that study. This inconsistency between the two studies may be due to a number of factors, such as differences in the timing of recording of variables (we recorded variables on ambulance arrival whereas Olson recorded variables on hospital arrival) or differences between the study populations.
Our study has some limitations that should be appreciated. We did not include all emergency medical admissions, but selected patients with specific ambulance codes who were more likely to have serious illness. Furthermore, some patients had to be excluded because they could not be given a clinical code. These patients tended to be younger and were less likely to die. These limitations mean that our findings may not be applicable to medical admissions with less severe illness. The data were not originally collected to address the aims of this study. In particular, we measured systolic blood pressure, whereas REMS originally used mean arterial pressure. This conversion may explain why blood pressure was a poor predictor of mortality in our cohort. There were also many data missing, which may bias our estimates or limit the applicability of our findings. Just as the performance of REMS in Olsons’ study may be overestimated because it was derived in this population, so the performance of our new score, consisting of age, GCS, and oxygen saturation, is also likely to be an overestimate. Further studies are required to validate this score and determine whether heart rate and respiratory rate are independent predictors of mortality.
It is also possible that other variables may be useful predictors of mortality but were not recorded in our study. For example, body temperature is not usually recorded by ambulance staff, so we were unable to compare REMS and RAPS to the Modified Early Warning Score,12 which uses body temperature in addition to blood pressure, pulse rate, respiratory rate, and level of consciousness to predict death, cardiac arrest, or need for intensive or high dependency care.
A useful predictor variable needs to be simple to collect, independent of other potentially useful variables, and strongly associated with mortality. Ideally, development of a risk stratification tool for emergency care should involve pilot studies to identify all potentially useful variables, measurement of the independent association between each variables and outcome, derivation of a score, and validation in a different population. In doing this, it should be recognised that a risk stratification tool that is useful for allowing case mix adjusted comparison of mortality may not be useful for triage or clinical practice. Predicting mortality in triage or clinical practice may need to differentiate between avoidable and unavoidable mortality.
In summary, we found that REMS was a better predictor of mortality in emergency medical admissions than RAPS. Age, GCS, and oxygen saturation appeared to be the most useful variables. A score including only these three variables may perform better than REMS.
Acknowledgments
We thank M Clancy for his help in developing and drafting this article.
REFERENCES
Footnotes
-
Competing interests: none declared
Linked Articles
- Primary Survey