Article Text

Abstract
Introduction There is uncertainty about the best way to measure emergency department crowding. We have previously developed a consensus-based measure of crowding, the International Crowding Measure in Emergency Departments (ICMED). We aimed to obtain pilot data to evaluate the ability of a shortened form of the ICMED, the sICMED, to predict senior emergency department clinicians’ concerns about crowding and danger compared with a very well-studied measure of emergency department crowding, the National Emergency Department Overcrowding Score (NEDOCS).
Methods We collected real-time observations of the sICMED and NEDOCS and compared these with clinicians’ perceptions of crowding and danger on a visual analogue scale. Data were collected in four emergency departments in the East of England. Associations were explored using simple regression, random intercept models and models accounting for correlation between adjacent time points.
Results We conducted 82 h of observation in 10 observation sets. Naive modelling suggested strong associations between sICMED and NEDOCS and clinician perceptions of crowding and danger. Further modelling showed that, due to clustering, the association between sICMED and danger persisted, but the association between these two measures and perception of crowding was no longer statistically significant.
Conclusions Both sICMED and NEDOCS can be collected easily in a variety of English hospitals. Further studies are required but initial results suggest both scores may have potential use for assessing crowding variation at long timescales, but are less sensitive to hour-by-hour variation. Correlation in time is an important methodological consideration which, if ignored, may lead to erroneous conclusions. Future studies should account for such correlation in both design and analysis.
- emergency care systems
- emergency care systems, emergency departments
- effectiveness
- crowding
Statistics from Altmetric.com
Key messages
What is already known on this subject?
Emergency department crowding is an important public health problem. There are many ways to measure emergency department crowding but it is not clear which measure is best.
What might this study add?
This pilot study shows that two widely used measures can be easily collected in English emergency departments. Clustering of observations in time and site is an important methodological problem that future studies should consider and report.
Introduction
Emergency department crowding is increasingly recognised as a global public health problem. Crowding impacts on both patients and staff.1–5 Delays to diagnosis and treatment are well described.6 ,7 Privacy and dignity are compromised and mortality is greater in patients who are admitted through crowded emergency departments.8–11 Crowding decreases staff and patient satisfaction and increases burnout. Recruitment and retention of emergency department staff is harmed.12
While there is widespread acceptance that emergency department crowding is important, there is little consensus on the best way to measure this.13 Measuring crowding is important because measurement allows the development and evaluation of interventions. Many studies use the need for ambulance diversion as a proxy measure for emergency department crowding; however, the practice of diversion is not widespread and depends on factors other than emergency department crowding. Occupancy is also used as a measure as it is easy to collect. The proportion of patients leaving before treatment is also easy to measure, but does not adequately measure the problem. The National Emergency Department Overcrowding Score (NEDOCS) measure, developed in the USA, is an extensively studied and validated measure of emergency department crowding14 ,15 but is used inconsistently. The NEDOCS measure correlates well with the proportion of patients leaving before being seen. The NEDOCS also predicts the need for ambulance diversion well, although this practice is restricted to large urban centres served by multiple emergency departments.16 The NEDOCS relies on seven variables recorded at a single point in time and entered into a formula to generate the NEDOCS score. The variables used in the NEDOCS score and the severity are shown in box 1.
The National Emergency Department Overcrowding Score (NEDOCS) score
▸ LED: Total number of patients in the emergency (ED), which is the number of patients in the ED occupying beds, including hallway beds
▸ bED: Number of ED beds, which is the total number of available ED beds
▸ Ladmit: Total number of admitted patients in the ED, which is the number of ED patients waiting to be moved from the ED to the hospital
▸ bh: Number of hospital beds, which is the total number of occupied and vacant inpatient beds
▸ WED: The waiting time from triage to ED bed placement for patients placed in ED beds
▸ Wadmit: The longest boarding time of patients waiting for admission
▸ Lrp: The number of ventilators in use in the ED
Categories of severity of the NEDOCS score:
▸ Level 1: Not busy (0≤NEDOCS <20)
▸ Level 2: Busy (20≤NEDOCS <60
▸ Level 3: Extremely busy but not overcrowded (60≤NEDOCS <100)
▸ Level 4: Overcrowded (100≤NEDOCS <140)
▸ Level 5: Severely overcrowded (140≤NEDOCS <180)
▸ Level 6: Dangerously overcrowded (180≤NEDOCS)
The NEDOCS formula, which assigns weights to the variables to generate the NEDOCS score for a single point in time, is as follows:
However, the NEDOCS is complex and there are concerns that it does not generalise well across differing settings.15 ,17 Our research group has previously developed, by a formal consensus process involving 40 emergency physicians across the world, a measure of emergency department crowding.18 This is an 8-point measure called the International Crowding Measure in Emergency Departments (ICMED), shown in table 1. These are intuitive and simple to apply. Seven of the eight measures are recordable in real time; however, the ‘left before treatment’ measure cannot easily be recorded in real time but is best reported historically. The ICMED in the real-time data collection 7-measure format has been partially validated and shows good discriminant and face validity.19 We now propose that, for real-time measurement of crowding, the 7-measure format of ICMED be used and referred to as short International Crowding Measure (sICMED) in emergency departments. The sICMED is a simpler measure to collect than the NEDOCS.
International Crowding Measure in Emergency Departments (ICMED)
We aimed to obtain pilot data from our region comparing the sICMED against the NEDOCS in predicting clinician concerns about crowding and safety. This would allow for a priori power calculations for future comparative work. We also aimed to see whether collecting data for these scales was feasible in English emergency departments and to explore the effect of clustering, both by centre and in time, on the estimates that we obtained. Knowledge of how clustering interferes with estimates would improve subsequent study designs on crowding.
Methods
We conducted the study in four hospitals in the East of England in spring 2013; one was a very large teaching hospital, one was a large District General Hospital and the remaining two were small District General Hospitals (table 2). One of the investigators collected hourly data between Monday and Friday. Observations ranged from 09.00 to 22.00. Each day of observation was considered an observation set. A total of 10 observation sets were collected, each of 6–10 h duration with 1–5 observation sets per site. At each hour the investigator measured the crowding status of the emergency department by recording violations of the seven sICMED items to give a score of 0–7, and the seven variables required to calculate NEDOCS in real time. At the same time, the consultant in charge of the emergency department was asked to record his/her opinion of how crowded and dangerous the emergency department was on a 10 cm visual analogue scale ranging from 0 (not at all crowded) to 10 (extremely crowded). The clinician was blinded to the crowding scores but fully aware of the pressure that the department was under. We purposively sampled mainly through the afternoon and evening and a mix of weekdays when historical data indicated the demands for service were greatest and showed the greatest changes. This choice of hours meant that a senior clinician would be in charge of the emergency department at these times and therefore add validity to the reference standard.
Characteristics of participating centres
We transformed the NEDOCS scores into six levels using previously derived thresholds of severity.20 We were unable to perform an a priori power calculation for this study as we did not know how the NEDOCS would perform in England or whether collection was feasible. We were advised by our Local Research and Ethics Committee that formal ethical approval was unnecessary as this was a service evaluation and no patient contact was needed.
Statistical analysis
We plotted each set of observations as a time series, which showed that the observations were highly correlated in time within an individual observation set. To assess the impact of this correlation on our statistical inference, we ran a series of models. Each model is run for two different outcomes (perception of crowding and perception of danger) and two separate exposures (sICMED score and NEDOCS score), giving four possible combinations of outcome and exposure.
For each combination of exposure and outcome we ran the following sequence of models. First, we ran a simple regression model with a single outcome and single exposure. The assumption of the simple regression model is that the observations are independent, which we know they are not. This model would therefore give us the naïve result. We then introduced a random intercept for observation set to the regression model. The role of the random intercept is to capture differing mean levels of perception of danger between observations sets. In such a model the estimated association can be regarded as the association within observation sets as opposed to between them—that is, the difference in the mean sICMED score or NEDOCS score between observation sets is not driving the associations, but that the changes within an observation set are. The assumption of this model is now that observations are independent conditional on being within the same observation set rather than the assumption of complete independence made in the simple regression model. Even this assumption is likely to be unreasonable as it treats all observations within a set as unrelated to the others. In reality, those taken close in time are likely to be more similar to those taken some time apart (ie, there is likely to be correlation in time). The third model addresses this problem where, rather than a simple random intercept, we model the data as an AR(1) process. This is the simplest repeated measures model which allows observations to be correlated with other observations, in this case assuming a constant correlation of any one observation with the observation immediately preceding and following it. Fourth, we augment this model with a fixed effect for time to account for the fact that time may independently drive both the perception variables and the objective variables. One way to conceive this is to imagine the situation where someone guessed a score for perception of crowding based only on the time of day without even being in the emergency department. Given the daily cycle of emergency department demand, it is likely that such a score may still correlate highly with the objective measures. As such, adjusting for time of day is desirable to see the true association.
Finally, acknowledging that the clustered nature of the data is inhibiting our ability to draw firm conclusions, we present a simplified analysis where we treated each set of observations as a single aggregated observation, thus reducing our observations from 82 to 10. For each observation set we take the mean score on the NEDOCS, sICMED, perception of crowding and perception of danger ratings. We assessed associations between each crowding score (NEDOCS and sICMED) and each of the perception ratings using linear regression. In each model either the perception of crowding or perception of danger is used as an outcome and either the NEDOCS or sICMED scores are used as exposures. Thus, a total of four models of this type were employed (the same combinations of outcome and exposure as above). Further, we adjusted for site as a categorical variable (fixed effect) to account for potential clustering of observation by site. A fixed effect was used as only four sites were involved. This model can be considered to explore the association within the site but between observation sets at that site. Although residuals were inspected and no serious concerns regarding departure from normality were found, the limited number of observations (n=10) made this difficult to assess and resulting inference (p values) should be treated with caution.
Throughout the above analysis we present the regression coefficients as standardised regression coefficients (standardised βs) which are equivalent to correlation coefficients in the case where only one explanatory variable is present. The coefficients can be interpreted as the number of SDs in the crowding score associated with a 1 SD change in perception rating. Data manipulation, graph production and the final simplified (aggregated) analysis was completed using Stata V.13.1 Regression modelling of individual data points was completed using SAS V.9.4.
Results
We conducted 82 h of observations in four different emergency departments. There were no missing data. Using the NEDOCS scale, our emergency departments were crowded 34% of the time and, using the sICMED cut-off of ≥3 violations, our emergency departments were crowded 47% of the time.
Figure 1A, B shows the time series for all four measures. As can be seen, they are highly correlated in time with each observation generally very close to the preceding and following one. The sICMED score shows the most point to point variation, which is largely apparent because of the limited number of values it can take (integers between 0 and 7). Table 3 shows the results of the regression models for the series of models applied to the individual data points (as opposed to aggregated data). The simple regression models show strong relationships between both the sICMED and NEDOCS scores and both the perception of danger and perception of crowding measures (standardised coefficients of ≥0.63). Further, these associations appear to be highly statistically significant (p<0.0001 for all). By introducing a random intercept for the observation set, the results remain highly statistically significant but the estimated association weakens. This attenuation is most apparent for the sICMED score models. By modelling the between observation correlation using the AR(1) model, the standardised coefficients attenuate further, particularly so for the sICMED models where they reduce to very small values (<0.1). Along with this attenuation, the sICMED coefficients lose statistical significance. Finally, adding the effect of hour of day attenuates the NEDOCS coefficients further with no change or a slight increase in the sICMED coefficients. We also note that the width of the CIs for the NEDOCS models grows with increasing complexity of the model, indicating the increasing SE.
Output of regression models

Time series for each observation set for the sICMED and NEDOCS scores and the clinicians’ perception of crowding (A). Time series for each observation set for the sICMED and NEDOCS scores and the clinicians’ perception of danger (B). NEDOCS, National Emergency Department Overcrowding Score; sICMED, short International Crowding Measure.
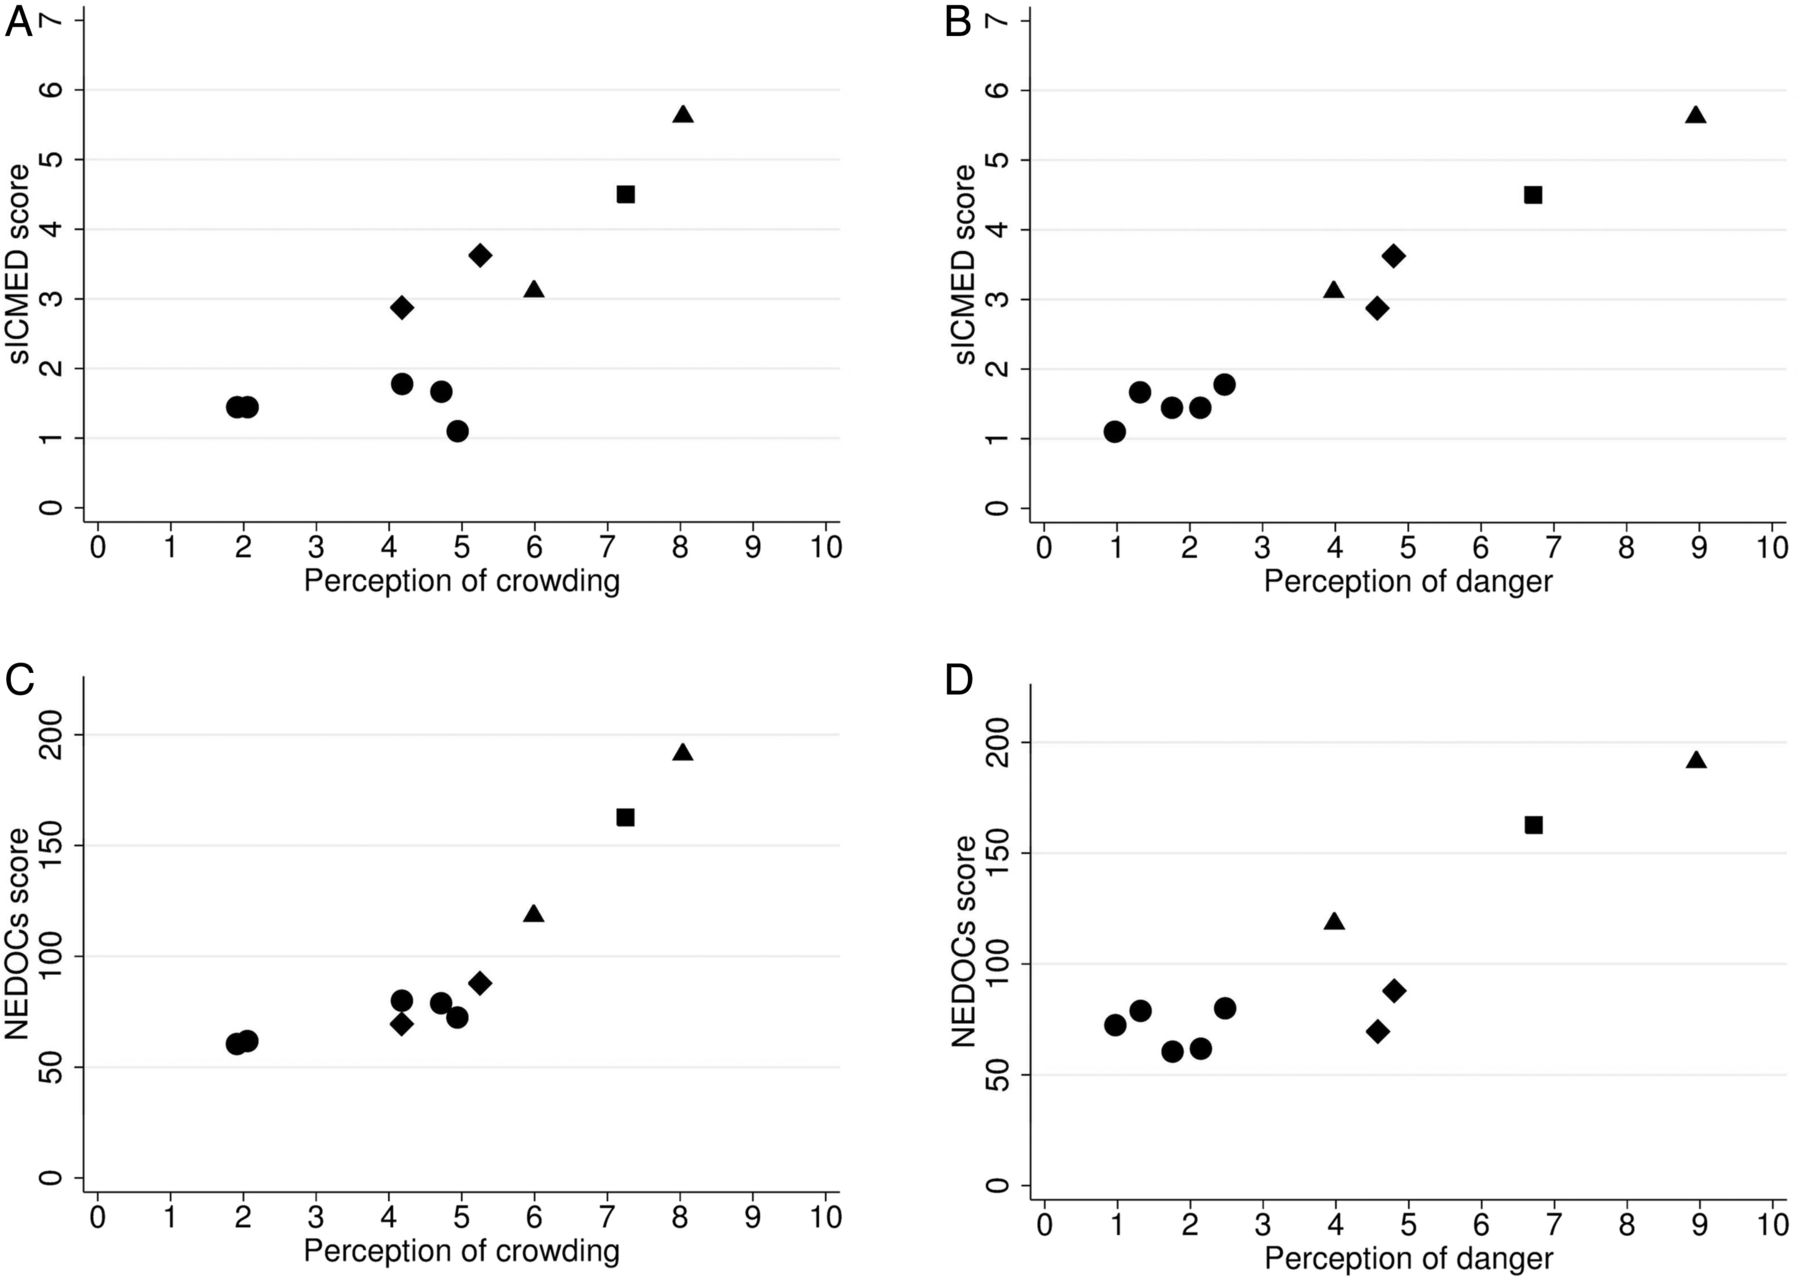
The association between each crowding score (NEDOCS and sICMED) and each of the perception ratings, when averaged over an observation set, is shown in figure 2A–D. Each shows a strong relationship, but with potentially strongly clustered observations by site. When adjusting for site in regression models, the relationship remained strong for the associations with perception of danger (standardised coefficient for NEDOCS 0.75, 95% CI 0.25 to 1.24, p=0.012; standardised coefficient for sICMED 0.83, 95% CI 0.49 to 1.17, p=0.002). In contrast, the associations with perception of crowding were substantially attenuated such that they became consistent with chance findings (standardised β for NEDOCS 0.51, 95% CI −0.09 to 1.11, p=0.080; standardised β for sICMED 0.34, 95% CI −0.42 to 1.11, p=0.301).
Association between observation set mean scores between (A) sICMED score and perception of crowding, (B) sICMED score and perception of danger, (C) NEDOCS score and perception of crowding and (D) NEDOCS score and perception of danger. In each plot each point represents an observation set and the different shapes represent data from different hospitals. NEDOCS, National Emergency Department Overcrowding Score; sICMED, short International Crowding Measure.
Discussion
This study has demonstrated that it is feasible to collect both NEDOCS and sICMED scores in UK emergency departments. While at face value both measures appear strongly correlated with clinician concerns about emergency department danger and crowding, issues connected with the data collection pattern and correlation in time of data points make interpretation challenging. The final simplified analysis looking at associations between mean scores for each observation set (rather than within them) suggest evidence of an association of both NEDOCS and sICMED scores with clinicians’ perception of danger but not crowding. However, due to the small sample size (10 observation sets), the uncertainty on these estimates is very large and consequently both strong and weak associations between the crowding scores and clinicians’ perceptions could be consistent with these data.
Before discussing the limitations associated with clustering, it is worth noting some important methodological flaws to our work. We took a convenience sample and did not sample after 22.00 or at weekends. We cannot be sure whether our results would be the same if we had sampled overnight or at the weekend. Based on our own clinical experience, we think we have a reasonable spread of times that represent both crowded and non-crowded times. Our measure of clinician concern can also be criticised for not using a validated measure; however, there are no relevant validated scales that we could use. Although we tried to blind the senior clinician to the sICMED scores, we have conducted previous sICMED validation studies in these hospitals and it is possible that there may have been some observer bias.
As mentioned above, the correlated nature of the observations makes drawing robust inferences about the measure challenging. First, we note that a naive approach which treats all observations as independent will overestimate the statistical significance of the results. This is because the observations are similar to those made at adjacent time points (and, indeed, with those made at any time within an observation set). A simple treatment of this within observation set correlation using a random intercept is unlikely to account for all the correlation present as this still assumes that, within an observation set, individual observations are independent rather than being correlated in time. We find that, when we model this correlation in time, substantial attenuation is seen in the strength of the association. For the sICMED score this attenuation led to correlations close to 0 while, for the NEDOCS score, the attenuation was such that only modest correlation was seen. We suggest that this attenuation is likely to arise due to the reduced variation in crowding within an observation set, such that the noise (residual variation) associated with the scores is relatively more important. In effect, we can think of the noise on the scores as the difference between the true underlying construct (crowding) and the score. We saw from figure 1A, B that the noise on the sICMED score appeared higher than on the NEDOCS score. As a more sophisticated model accounts for the variation in crowding, the noise becomes more important. The consequence of this is that the reliability of both scores effectively reduces. Less than perfect reliability leads to attenuation of effect sizes, with the attenuation being proportional to the reliability.21 Given that the noise is higher for the sICMED score than the NEDOCS score, we would expect the reliability to be lower for the sICMED score and hence be subject to a larger degree of attenuation, which is exactly what we observed. This reduced reliability should not be interpreted as simply a modelling problem but reflects the fact that noise masks true small differences.
Taking the results as a whole, and acknowledging the large degree of uncertainty in the between observation set results, one might conclude that both sICMED and NEDOCS scores are potentially useful tools for assessing crowding at distant time points, but that they are potentially less sensitive (NEDOCS) or insensitive (sICMED) tools for measuring hour-by-hour variation in crowding. Of course more data are needed to reduce the uncertainty and confirm these conclusions.
Our findings have implications for future studies involving these or other measures of crowding. Given the high degree of hour-by-hour correlation observed, there is, in general, little to be gained in repeating measures every hour over a few hours in a single location. Rather, individual measurements spread over time such that the degree of correlation between them was minimised would be a more efficient use of resources. Where observations are taken close together, sample sizes may need to be substantially increased to account for the temporal correlation. There are also implications for the interpretation of existing studies, and this methodological finding invalidates some of our own previous work.19 Extreme caution should be applied when drawing inferences based on naive treatment of observations which are likely to be correlated in time. Accounting for the correlation requires advanced statistical modelling techniques, the impact of which will be both measure- and context-specific.
Future work
In addition to reducing the uncertainties in associations presented here, the sICMED requires validation against some ‘harder’ consequences such as mortality, cancelled elective surgery, patient experience and medical outliers, as well as validation outside of the East of England.
Conclusions
We have demonstrated that the sICMED and NEDOCS scores can be collected easily in UK emergency departments. Further studies are required to give definitive conclusions, but this initial work suggests that the scores, while less sensitive (NEDOCS) or insensitive (sICMED) tools for measuring hour-by-hour variation in crowding, might have potential uses for assessing crowding variation at longer timescales. Correlation in time is an important methodological factor that should be considered in the interpretation of previous studies on crowding and in the design of future work. We recommend that future studies that evaluate emergency department crowding measures should have large time gaps between observations to minimise the effect of clustering.
Acknowledgments
We are very grateful to Professor Steve Goodacre and the anonymous statistical reviewer for their thoughtful comments on the manuscript and support during the peer review process.
References
Footnotes
Contributors AB conceived and wrote the study report. PR collected the data. JO, VD and RA facilitated local data collection. RA, JB and IM analysed the data. GA provided expert statistical advice. All authors read and approved the final version of the manuscript.
Competing interests None declared.
Provenance and peer review Not commissioned; externally peer reviewed.
Data sharing statement The data are available on request from the lead author.