Article Text

Abstract
Introduction Hospital inspection and the publication of inspection ratings are widely used regulatory interventions that may improve hospital performance by providing feedback, creating incentives to change and promoting choice. However, evidence that these interventions assess performance accurately and lead to improved performance is scarce.
Methods We calculated six standard indicators of emergency department (ED) performance for 118 hospitals in England whose EDs were inspected by the Care Quality Commission, the national regulator in England, between 2013 and 2016. We linked these to inspection dates and subsequent rating scores. We used multilevel linear regression models to estimate the relationship between prior performance and subsequent rating score and the relationship between rating score and post-inspection performance.
Results We found no relationship between performance on any of the six indicators prior to inspection and the subsequent rating score. There was no change in performance on any of the six indicators following inspection for any rating score. In each model, CIs were wide indicating no statistically significant relationships.
Discussion We found no association between established performance indicators and rating scores. This might be because the inspection and rating process adds little to the external performance management that EDs receive. It could also indicate the limited ability of hospitals to improve ED performance because of extrinsic factors that are beyond their control.
- performance improvement
- quality
- statistics
- emergency care systems, emergency departments
This is an open access article distributed in accordance with the Creative Commons Attribution Non Commercial (CC BY-NC 4.0) license, which permits others to distribute, remix, adapt, build upon this work non-commercially, and license their derivative works on different terms, provided the original work is properly cited, appropriate credit is given, any changes made indicated, and the use is non-commercial. See: http://creativecommons.org/licenses/by-nc/4.0/.
Statistics from Altmetric.com
Key messages
What is already known on this subject
The performance of emergency departments (EDs) varies considerably is of widespread concern and attracts considerable scrutiny.
National regulators perform inspections and publish inspection ratings, but the association of these ratings with accepted performance measures is not well understood.
There is no existing evidence on whether inspection and published ratings affect ED’s performance after inspection.
What this study adds
Ratings of EDs of 118 hospitals in England between 2013 and 2016 were not associated with their performance on six indicators prior to inspection. Nor did the performance on these indicators change after inspection.
Inspection and rating do not appear to reflect the actual performance of EDs or stimulate improvement.
Introduction
Many countries use hospital inspections and published ratings to measure and improve performance, but little is known about the likely impact.1 Such systems of regulation, including inspection, accreditation and certification, have been the topic of several reviews.2–4 Brubakk et al found no evidence in support of the effectiveness of accreditation and concluded that quality of care was not improved by this approach. Hinchcliff et al noted the lack of robust studies in this area and concluded that further research is needed. Flodgren et al found only two studies and therefore drew no conclusions on the impact of external inspections on quality standards.
In England, hospital inspection and rating are conducted by the Care Quality Commission (CQC). They inspect all hospitals in England and undertake focused inspections in emergency departments (EDs). They rate the performance of EDs on a four-point scale (outstanding, good, requires improvement or inadequate) in five domains or areas (effectiveness, safety, care, responsiveness and leadership) and also assigned an overall rating.
In England, the performance of EDs is also measured through a set of performance indicators that are defined and used by the National Health Service (NHS) to provide information on the quality of care of EDs to help support quality improvement:5–7
Performance on these indicators is published every month (box 1). All indicators relate to first and unplanned follow-up attendances. Indicators one to five decrease with better ED performance. Indicator six increases with better performance.
ED performance indicators.
Time to initial assessment: The median time (in minutes) between the patient’s arrival and their initial assessment.
Time to treatment: The median time (in minutes) between the patient’s arrival and the start of their treatment.
Total time spent in the emergency department: The median time (in minutes) between the patient’s arrival and departure from the emergency department.
Left department before being seen for treatment: the percentage of attendances with a ‘disposal-type’ of Left Before Treatment.
Unplanned re-attendance: the percentage of attendances for which there was an unplanned re-attendance within 7 days.
Total time spent in the emergency department ≤4 hours: the percentage of patients for whom their total time spent in the emergency department is less than 4 hours.
ED, emergency department.
CQC inspections of EDs follow a detailed inspection handbook, which sets out the areas of investigation to be explored, what information should be gathered in assessing performance and the process for assigning ratings.8 The inspection handbook covers some of the same issues as the NHS England performance indicators, including waiting times for assessment, treatment and admission, and unplanned re-attendance. As the selected examples in table 1 show, the inspection reports may refer directly to the indicator metrics.
Selected extracts from CQC inspection reports that refer to performance on the NHS England indicators
These report extracts suggest that we may expect to see a relationship between the CQC ratings and the NHS England performance indicators, but the reports have not been identified systematically. In this paper, we examined whether those EDs which do well on the NHS England performance indicators also perform well when inspected and rated by CQC, and vice versa. Further, we examined whether, after a CQC inspection, performance on the NHS England indicators improves, especially for EDs which were rated inadequate or requires improvement, as these departments probably have both the greatest scope for improvement and the strongest incentive to do so. To test these hypotheses, we examined whether prior levels of performance on six indicators were associated with the ratings they received when inspected. We also analysed whether levels of performance on those indicators changed following inspection and rating, for all EDs and specifically for providers who were rated as requires improvement or inadequate.
Methods
Data
We used inspection data from the CQC9 and data on hospital activity10 to analyse the associations of inspections and ratings between 2013 and 2016 with hospital performance in England.
CQC provided information on the inspection date, the rating scores and when the inspection report was published for all first inspections of ED services in England (207 in total). We used the results from first inspections as these are large-scale and inspect more aspects of care than subsequent re-inspections, which are smaller and more targeted.
We used activity data from EDs between April 2012 and September 2016 to generate results for the six indicators that are routinely used to measure ED performance. The indicators were created for type 1 EDs only. These are departments that provide 24-hour consultant-led care. Single-specialty and minor injury units are excluded.
Indicators measuring time to initial assessment, time to treatment and total time in the ED were cleaned to remove values where the time was either zero or 24 hours. These values are highlighted by NHS Digital in the indicator methodology documentation as suggesting issues with data quality.6 From 65 million ED attendances, the cleaning resulted in 6.67% of attendances removed for a time to initial assessment, 1.48% removed for a time to treatment and 0.06% removed for total time in the ED.
CQC inspected and rated ED services at 207 individual hospital ED sites. The hospital activity data, and therefore our indicators, were available for 150 hospital trusts, some of which include multiple hospital sites. Our analysis could only be conducted where the two data sources could be linked, that is to say, for single site trusts or multi-site trusts with the same rating for all their sites. We linked the data at hospital trust level keeping 118 trusts consisting of 86 single site trusts and 32 multisite trusts with the same inspection date and rating for all their sites.
Analysis
We examined whether levels of performance before the inspection cycle started differed according to the subsequent rating score. This shows if EDs that are judged to be better by the CQC also tend to have shorter waiting times, fewer walk-outs before treatment and fewer re-attendances. We only considered performance in the period April 2012 to September 2013, before the inspection cycle started.
We also examined whether the indicators of ED performance changed after the services were inspected. We allowed for differential effects depending on the rating score and examined whether there were changes shortly before the inspection and in the short term and long term after the inspection. We used a multilevel linear regression model with indicators for trust and month. Observations were weighted by the volume of emergency attendances. We modelled the performance indicators using two sets of variables indicating the period following the inspection and the rating that the service received. The short-term post-inspection period covers the inspection month and the 6 months immediately following. This period differs across hospitals as inspections occurred at different times.
Additional models allowed trusts to respond 1 month prior to inspection (an anticipation effect) and to respond >6 months after the inspection (longer-term effect). These analyses included data until September 2016 and therefore, the follow-up period was dependent on the timing of the inspection.
All models were estimated on trust-level data. We used separate multilevel models for each performance indicator with trust effects, to account for unobserved factors affecting performance, and indicators for a month, to account for seasonal effects. The volume of emergency attendances per trust per month was included to control for the effect of demand on performance. Observations were also weighted by emergency attendance volume to account for outliers and non-normality caused by skewness.
Seven trusts received the lowest rating of Inadequate and seven trusts received the highest rating of Outstanding. Due to the very small number of trusts with these ratings, we combined the two higher and the two lower rating score categories such that ratings were distinguished as either positive (good or outstanding) or negative (inadequate or requires improvement).
We undertook three forms of supplementary analyses in which we repeated the main analysis: (1) without the removal of exactly zero or 24-hour ED waiting times; (2) using the original four category rating score and (3) using the publication date of the rating report in place of the inspection date.
Hospital activity data were provided by NHS Digital under a bespoke data sharing agreement. CQC data are publicly available. The study did not require ethical approval.
Results
In the period before the inspection cycle started, on average, the hospitals performed an initial assessment after 6 min, treated patients after 59 min and kept patients in the ED for a total of 145 min (table 2). 2.81% of attendances ended with the patient leaving the department before being seen and 5.91% of patients returned to the ED within 7 days. The average percentage of patients achieving the target of <4 hours spent in the ED was 94%. Figure 1 displays the number of ED ratings, grouped as either positive or negative, and their corresponding inspection month. Rating scores were evenly distributed between these two rating outcomes and over the inspection period.
Summary statistics for ED indicators
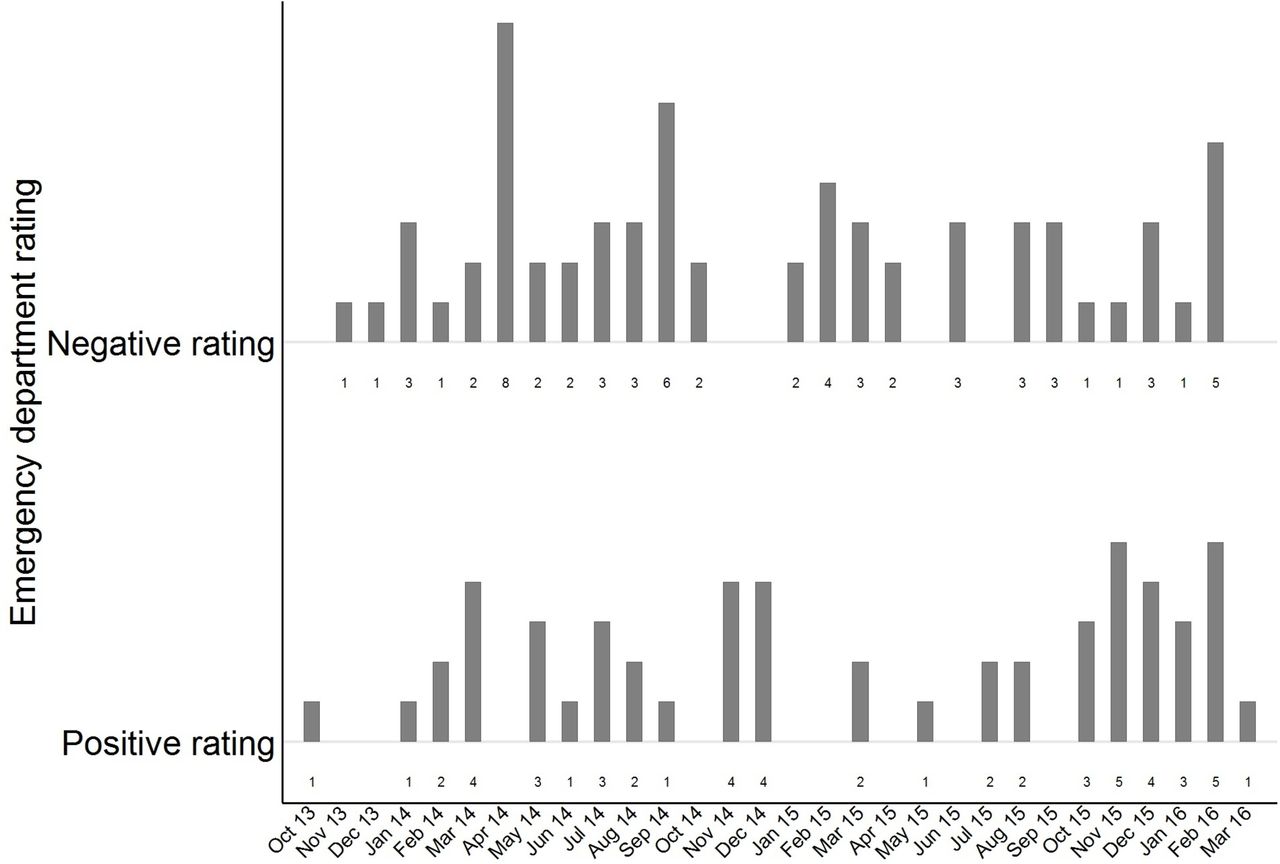
Number of inspections each month by rating score.
Figure 2 presents the mean values of each indicator from April 2012 to September 2013 split by subsequent rating score. Across these six indicators, there are some isolated cases where performance appears to differ by subsequent rating score. However, overall, there is no clear pattern in these differences. This finding is confirmed in table 3 when indicator performance was regressed on the rating score. In table 3, the coefficients represent the difference in indicator performance, measured in minutes or percentage points, observed prior to inspection for those departments with a positive rating compared with those with a negative rating. For example, the results indicating EDs with a positive rating had shorter times to assessment (1.713 min) in the pre-inspection period. Similarly, EDs with a positive rating had 0.159% more patients leaving without being seen. However, across all six indicators, the difference is only statistically significant for performance on the 4-hour target and suggests that EDs with positive ratings performed better on this indicator.

ED indicators for each rating score. ED, emergency department.
Differences in indicators in the preinspection period
Table 4 presents the results from our main model specification focusing on the post-inspection period. For each of the ED performance indicators, coefficients are presented in either minutes for time-dependent indicators or percentage for all others. There were no statistically significant changes in these coefficients and hence no detected change in ED performance after services had been inspected, regardless of the inspection rating they received.
Changes in ED indicators post-inspection by rating score
In table 5, we present the results including terms capturing an anticipation effect and a longer-term post-inspection effect (>6 months). There is weak evidence of anticipation effects, indicating that services that subsequently had inadequate and requires improvement ratings deteriorated on the 4-hour target in the month prior to inspection. There was no statistically significant change over the longer time period.
Changes in ED indicators preinspection and post-inspection by rating score
Similarly, three different supplementary analyses found no significant relationship between indicators and inspection ratings. These analyses included outlier values for waiting times, the original four category rating score and the publication date of the rating report.
Discussion
Summary of findings
In this study, we failed to detect a relationship between indicator performance and CQC inspection ratings during the period 2013–2016 in England, either before inspection or post-inspection. This does not exclude the possibility that a relationship exists, but that we were unable to detect this in our analysis.
In the period before CQC inspections began, there was considerable variation in the performance of EDs on the six indicators analysed in this study. However, this variation was not associated with subsequent rating scores; that is, we did not find evidence that services with different inspection rating scores systematically performed differently before inspection. Because the CQC inspection process gathers a much wider and richer dataset than the six indicators, we would not necessarily expect a strong relationship between ED indicator performance and subsequent scores. However, we would have expected to see some association. The absence of such an association raises questions about the validity or reliability of the ED performance indicators or the CQC inspection ratings (or both) as measures of quality,
Using the NHS England indicators, we also found no evidence that, after inspection, EDs changed their performance. This is both when looking at the short-term (6 months) and long-term (>6 months) post-inspection effects. It may be that the performance management regime in EDs, with intense attention from both NHS England and NHS Improvement, combined with the publication of regular performance statistics, leaves little room for CQC’s inspection process to generate additional improvement. It might also suggest that the variations in performance result from extrinsic factors (such as the availability of primary care services, alternatives to EDs, such as walk-in clinics and social care provision) rather than from intrinsic factors more under the control of hospitals.
Strengths and weaknesses
Our study focuses on the first round of a new inspection regime in England and therefore contributes to our understanding of the impact of large-scale and targeted inspections. We chose to look at ED services because they are a distinctive and separate clinical service with a substantial amount of available data regarding performance and because they are separately inspected, rated and reported on by CQC. In doing so, we ensure that our measures of performance are as targeted as they can be. In the absence of a randomised control trial, we cannot rule out all forms of bias, but our statistical methods have been selected to minimise its impact. Our analysis takes advantage of the timings of inspection that are not random but plausibly exogenous to service performance, and we controlled for seasonal and macro effects. We further controlled for ED demand and weighted our models by patient volumes.
Our study is limited as we cannot link activity data and ratings for all EDs. We had to exclude 46 hospitals across 20 hospital trusts. The distribution of rating scores is broadly similar between the departments included in and excluded from the study.
Policy implications
Our study suggests that the effects of CQC’s inspections and ratings are not measurable using the metrics widely used by NHS England and the Department of Health and Social Care in performance management. This could result from four possible scenarios: (1) the chosen indicators are valid measures of quality, but CQC inspection ratings are not; (2) the chosen indicators are not valid measures of quality, but the CQC inspection ratings are; (3) both are valid measures of quality but they measure different aspects or dimensions of quality; or (4) neither are valid measures of quality.
CQC intends to move towards a more intelligence-led approach to regulation,11 and such an approach will rely more heavily on routine data such as the indicators used in this study. Our findings suggest that CQC may wish to consider developing new measures of performance or using existing measures differently.
Our findings suggest that when future regulatory interventions such as inspection programmes are being developed, they should be piloted and tested to evaluate their association with other performance measures and to assess their effects before being widely implemented.
Footnotes
Contributors TA, KW, NP and MS: design of this study. TA: conducted the analysis. TA, KW, NP and MS: drafted this article.
Funding This research was funded by the NIHR Policy Research Programme (PR-R11-0914-12001). The open access funding was provided by the Institute for Health Policy and Organisation, University of Manchester.
Disclaimer The views expressed are those of the author(s) and not necessarily those of the NHS, the NIHR or the Department of Health and Social Care.
Competing interests None declared.
Provenance and peer review Not commissioned; externally peer reviewed.
Correction notice Since this article was published online, the text from figure 1 has been added to the text and figure 2 and 3 have been renumbered as figure 1 and 2.
Linked Articles
- Commentary