Article Text

Abstract
Background Capillary refill (CR) time is traditionally assessed by ‘naked-eye’ inspection of the return to original colour of a tissue after blanching pressure. Few studies have addressed intra-observer reliability or used objective quantification techniques to assess time to original colour. This study compares naked-eye assessment with quantified CR (qCR) time using polarisation spectroscopy and examines intra-observer and interobserver agreements in using the naked eye.
Method A film of 18 CR tests (shown in a random fixed order) performed in healthy adults was assessed by a convenience sample of 14 doctors, 15 nurses and 19 secretaries (Department of Emergency Medicine, Linköping University, September to November 2017), who were asked to estimate the time to return to colour and characterise it as ‘fast’, ‘normal’ or ‘slow’. The qCR times and corresponding naked-eye time assessments were compared using the Kruskal-Wallis test. Three videos were shown twice without observers’ knowledge to measure intra-observer repeatability. Intra-observer categorical assessments were compared using Cohen’s Kappa analysis. Interobserver repeatability was measured and depicted with multiple-observer Bland-Altman plotting. Differences in naked-eye estimation between professions were analysed using ANOVA.
Results Naked-eye assessed CR time and qCR time differ substantially, and agreement for the categorical assessments (naked-eye assessment vs qCR classification) was poor (Cohen’s kappa 0.27). Bland-Altman intra-observer repeatability ranged from 6% to 60%. Interobserver agreement was low as shown by the Bland-Altman plotting with a 95% limit of agreement with the mean of ±1.98 s for doctors, ±1.6 s for nurses and ±1.75 s for secretaries. The difference in CR time estimation (in seconds) between professions was not significant.
Conclusions Our study suggests that naked-eye-assessed CR time shows poor reproducibility, even by the same observers, and differs from an objective measure of CR time.
- acute care
- clinical assessment
- emergency department management
- trauma
- resuscitation
This is an open access article distributed in accordance with the Creative Commons Attribution Non Commercial (CC BY-NC 4.0) license, which permits others to distribute, remix, adapt, build upon this work non-commercially, and license their derivative works on different terms, provided the original work is properly cited, appropriate credit is given, any changes made indicated, and the use is non-commercial. See: http://creativecommons.org/licenses/by-nc/4.0/.
Statistics from Altmetric.com
Key messages
What is already known on this subject
Capillary refill (CR) is frequently recommended for assessment of patients. However, subjectivity and a lack of standardisation in the execution and interpretation of the traditional CR time test may limit its clinical usefulness.
Studies concerning agreement between observers or repeatability by the same observer using naked-eye assessment of the same CR test are few.
What this study adds
In this study using videos, assessment of capillary refill time showed pronounced underestimation and overestimation compared to quantified CR time. Categorical assessment of fast, normal or slow was not more accurate.
The agreement for the categorical assessment for naked eye was not more reliable.
There was a low intra-observer repeatability and poor interobserver agreement by clinical staff in their naked-eye assessment of CR time.
Introduction
The capillary refill (CR) test is used in several globally implemented frameworks for assessment and resuscitation in patients with trauma (eg, ATLS), in paediatric emergency medicine (eg, APLS) and several paediatric triage systems.1–3 The test is conducted by pressing a finger on a tissue (most often the skin) to cause blanching, and optically estimating the time to return to original colour.4 Naked-eye assessment of the CR time was suggested for the initial evaluation of blood loss in wounded soldiers in 1947, and was categorised into ‘normal’, ‘definite slowing’ or ‘very sluggish’.5 In 1981, Champion et al arbitrarily defined an upper limit of 2 s as the normal CR time.6 Although the 2 s definition of upper limit of normal is most well known, other definitions have been suggested that take into account age and gender, advocating a 2.9 s upper limit for women and a 4.5 s cut-off for the elderly.7 In children, a range of 2–3 s has been suggested as normal.8–10
Our understanding of the underlying physiology of CR response is incomplete, and critics claim that the subjectivity and a lack of standardisation in the execution and interpretation of the CR test may limit its clinical usefulness.11 12 Studies concerning reproducibility between observers or repeatability by the same observer using naked-eye assessment of repeated CR tests are scarce.13 14 There are few studies on CR using objective skin blood content quantification techniques, and these focus on the technique rather than the CR time itself or comparisons with naked-eye estimations.15–18 Consequently, both those who believe in the clinical value of the CR time test and those who do not, have essentially only had subjective, naked-eye data to consider when forming their opinion.
The skin’s dermal layer includes the red blood cell containing capillaries and sub-papillary plexa, which contribute to skin colour.19 Most of the capillaries are emptied when blanching pressure is applied and the refilling, indicated by return of original colour, occurs at various speeds depending on multiple factors, for example, age, skin temperature and sex. Polarisation spectroscopy16 can detect the change in concentration of red blood cells in the dermal layer, with a resolution of 25 frames per second (0.04 s) for the whole of the observed period after blanching pressure. In analysis of this data, we have previously suggested an objective quantified capillary refill (qCR) time endpoint called time to return to baseline 1 (tRtB1) as an equivalent for the skin to ‘regain its original colour’.4 5 15 From the data curve, we can also derive time to peak erythema (tPk), physiologically corresponding to the reactive hyperaemia observed in many cases after the return to baseline (figure 1).16 20 21 In this study, we asked participants to estimate time for return to original colour, but we do not know which of our measured values (tRtB1 or tPk) might be closest to their ‘naked-eye’ estimates.

Delineation of a capillary refill curve where baseline represents the redness of skin before application of pressure. T=0 is the moment of pressure release during CR test. tRtB1 and tPk are shown. Each dot represents an image in which the concentration of erythrocytes has been quantified. CR, capillary refill; tPk, time to peak; tRtB1, time to Return to Baseline1.
The objectives of this study were thus to compare naked-eye assessment with the qCR time expressed as tRtB1 and tPk (in seconds); to measure the intra-observer repeatability and interobserver agreement in estimations of CR time among medical and non-medical staff and to investigate the agreement between ‘man’ and ‘machine’ in categorical estimations of the CR response.
Methods
Study design
This was an observational study of agreement between observer and machine-derived estimates of CR time and categorical assessments. We also investigated intra-observer repeatability and interobserver agreement of CR time estimates, as well as potential differences between professions. The study was approved by the regional ethical review board of Linköping, Sweden, and all volunteers and observers gave written and oral consent prior to participation.
Study setting and selection of observers
The study was carried out at the ED of Linköping University Hospital, Sweden. Data were collected between September and November 2017. Visual assessments were conducted by a convenience sample of 14 ED doctors (12±8 years of experience), 15 ED nurses (12±9 years of experience) and 19 secretaries (representing laymen). All observers watched a film of 18 CR videos in a set random order (in relation to CR time). Videos with data sets of quantified CR times (tRtB1 and tPk) were selected from our previously published material of healthy subjects.4 All tests had been performed on the finger pulp on 15 healthy volunteers (7 men) without medication, except for contraceptives. The calculated values of tRtB1 for the tests ranged from 0.16 to 9.76 s and tPk ranged from 0.68 to 10.36 s. The wide range of tRtB1 and tPk values among the volunteers was caused by differences in finger skin temperatures at the time of recording (range 30.2°C±3.5°C), as previously described.22
Randomisation was performed by a person who did not participate in the assessments and did not have any knowledge about the contents of the videos. Each film was shown to the observers on the same computer screen in a windowless room with consistent lightning.
Study protocol
Observers watched each video once and estimated both CR time in seconds and categorical assessment as ‘fast’, ‘normal’ or ‘slow’. The terms fast, normal or slow were chosen after consideration of different definitions of deranged capillary refill times in the literature.5 7 23 The time frame in which previous studies define normal lies within 2 s up to 4.5 s.4 7 24 In our estimation of correct classifications, quantitative cut-offs for the categorical evaluations of fast were defined as <2 s, normal as 2–3 s and slow as >3 s. Observers had 5 s to deliver their estimates after viewing each video. No information was given to the doctors or nurses about guidelines and reference values of CR time prior to the assessment. Secretaries were assumed to have less familiarity with the CR test, and were instructed to estimate time (in seconds) to when the colour of the blanched area had returned to the same colour as before the applied pressure and to give their categorical estimation of fast, normal and slow without information about our cut-off limits. All observers were shown two CR tests videos as practice prior to the tests included in the analysis.
The participants’ estimates were then assessed against measurements of the tRtB1 and tPk. The tRtB1 and tPk values calculated from the videos ranged from 0.16 to 9.76 s and 0.68 to 10.36 s, respectively. One slow video (tRtB1 7.28 s and tPk 10.2 s, videos 3 and 15), one normal video (tRtB1 2.40 s and tPk 7.68 s, videos 6 and 13), and one fast video (tRtB1 0.36 s and tPk 3.36 s, videos 5 and 10) were each shown twice without the observers’ knowledge to test intra-observer repeatability.
Data analysis
GraphPad Prism V.7.04 was used for statistical analysis. A Kruskal-Wallis test was conducted to compare naked-eye estimations and tRtB1/tPk values. In doing this, tRtB1 and tPk were considered to have been conducted an equal number of times to the number of naked-eye time estimates for each profession. Cohen’s Kappa was used to compare the categorical assessments made by the observers to the classifications based on tRtB1. Differences between professions in CR time estimation was tested with analysis of variance (ANOVA). A p value <0.05 was regarded as statistically significant.
To calculate interobserver agreement, a modification of the Bland-Altman plot,25 multiple observer Bland-Altman plot, was used.26 This method retains the capacity to evaluate consistency of agreement over different magnitudes of continuous measurements using a single plot. The limits of agreement with the mean represent how different an individual observer estimate compares with the mean measurement of all observers. The differences between each observer and the overall mean for each of the 18 videos were calculated according to the profession of a given participant. Systematic differences between observers were investigated using ANOVA, calculating mean square residuals by profession prior to constructing the plot.
Results
We recruited 51 observers, and complete data sets were available from 48 observers (14 doctors, 15 nurses and 19 secretaries). Of the three excluded observers, one secretary had misunderstood how to estimate the CR time, and two observers (one doctor and one nurse) failed to fill in the CR time in seconds and only completed the categorical evaluation.
Accuracy of naked-eye estimation compared to qCR time
Most observers assessed CR time in whole seconds rather than half seconds. There was a significant difference (p<0.05) between naked-eye assessment (in seconds) and qCR time expressed as tRtB1 for all videos, except for two (secretaries: video 13; doctors: video 16). The significant difference between naked eye and tRtB1 in video 6 was not seen for the identical video 13. Figure 2A-C allows a comparison at an overview level of the naked-eye assessment (in seconds) and the qCR values.
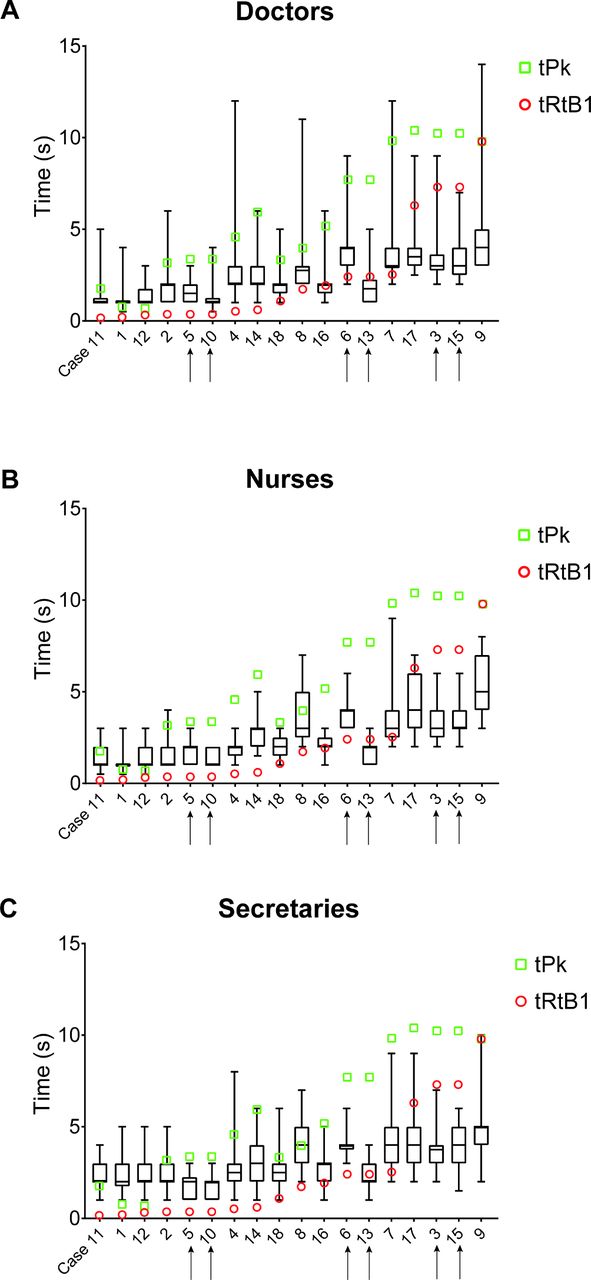
(A-C) Box plots of the naked-eye estimation of CR time in seconds, including the 5th to 95th percentile of the values. qCR time in tRtB1 (red circle) and tPk (green square) are shown for each video. The videos with the fastest tRtB1 values are plotted to the left and the slowest to the right on the x- axis. The number of each video indicates the order in which they were shown to the observers in the film. Videos 5 and 10, 6 and 13, and 3 and 15 (marked with arrows) are the videos that were shown twice. CR, capillary refill; qCR, quantified CR; tPk, time to peak; tRtB1, time to Return to Baseline1.
Naked-eye assessments in general overestimated short tRtB1 values (<1 s) and underestimated prolonged tRtB1 values (>5 s). The naked-eye time deviated more from tPk than tRtB1, with the deviation being even more pronounced with prolonged CR times. Specifically, there was a significant difference (p<0.05) between naked-eye assessment (in seconds) and qCR time expressed as tPk for all videos, except for two: for video 8, estimates of secretaries and a nurse did not differ significantly, and for video 11, there was no significant difference between tPk and observer estimates for all professions. The data support our original suggestion that tRtB1 is the qCR point with closest correlation to the naked eye estimations, and we therefore used only tRtB1 in our analysis of the categorical estimates.
Categorical assessments
Using our categorical definitions, the interobserver agreement of participants’ assessment of fast, normal or slow was 51% (Cohen’s kappa 0.27), corresponding to a poor agreement according to Fleiss’ Kappa Benchmark Scale.27
A wide intra-observer and interobserver variability in naked-eye categorical classifications compared with categorical classifications based on tRtB1 was seen (table 1). Percent of correct categorical estimates (fast, normal or slow) compared with qCR time classification are highlighted by green colour in table 1. There was a low consistency in naked-eye categorical evaluations for identical videos. For example, 57% of the doctors concluded fast in film 5 and 79% assessed it as fast the second time in the identical film 10.
Categorical evaluation of the 18 videos with fast, normal or slow tRtB1 times, including the three videos shown twice
Intra-observer repeatability
One slow CR test (tRtB1 7.28 s, videos 3 and 15), one ‘normal’ CR test (tRtB1 2.4 s, videos 6 and 13), and one ‘fast’ CR test (tRtB1 0.36 s, videos 5 and 10) were each shown twice without the observers’ knowledge.
The intra-observer repeatability in the naked-eye time estimation was highly variable. The proportion of identical time estimates for the repeated tests ranged from 6% to 60% (table 2). Differences in estimations of the same video of up to 3 s were seen. The observers’ second estimations differed from the first without apparent pattern, with the exception of the normal video, where a majority of observers estimated a faster time for the second observation (see online Supplementary figure S1).
Supplementary file 1
Intra-observer repeatability shown as the percentage of answers having identical time estimations
Using categorical estimation, the percentage of intra-observer repeatability (table 3) was slightly better than actual time estimations (table 2). Observers agreed with their prior classification 14%–71% of the repeated videos. Similar to the naked-eye time estimations, the repeatability was lowest in the normal range.
Intra-observer repeatability shown as the percentage of answers having identical estimations
Interobserver agreement
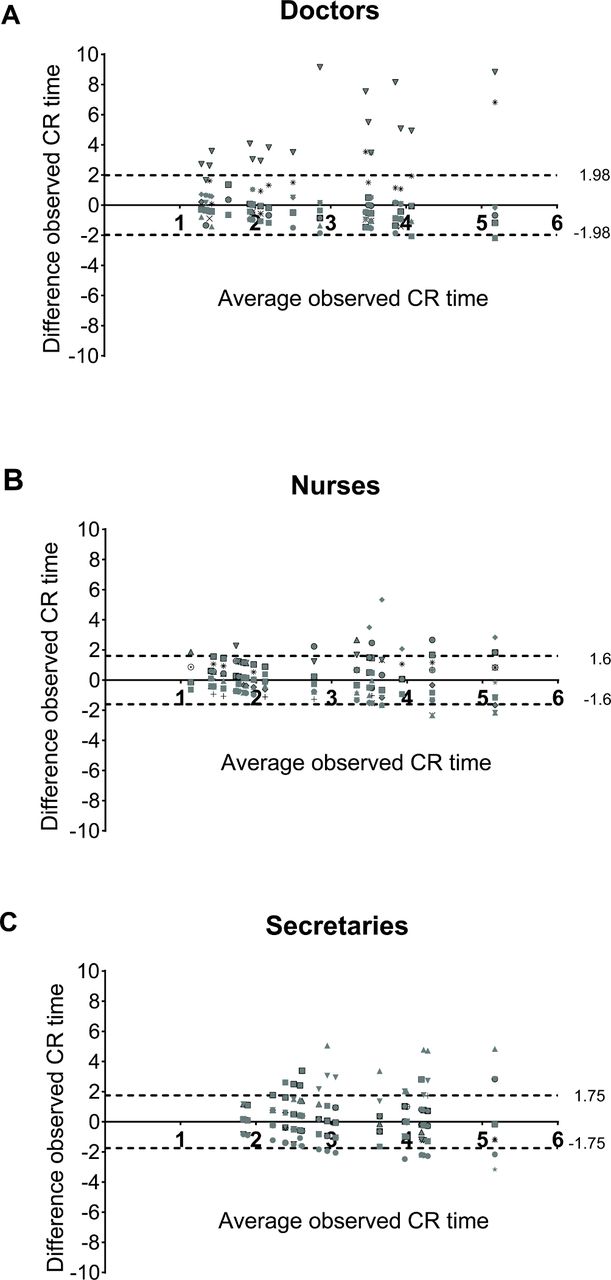
There were no significant differences (in seconds, p<0.05) between professions (ANOVA) in the naked-eye assessments, except for three videos (videos 1, 11 and 12), where a difference between the estimation by secretaries and the other professions was noted.
The 95% limits of agreement of the mean ranged between ±1.98 s for doctors,±1.6 s for nurses and ±1.75 s for secretaries (figure 3A-C). The doctors had the largest limits of agreement with the mean, but on closer analysis, this was due to two individuals with consistently outlying values. If these individuals were to be excluded, the limits of agreement for the mean of the remaining 12 doctors decreased to ±0.9 s.
![[emermed-2018-207948supp001.jpg]](https://emj.bmj.com/content/emermed/36/8/465/DC1/embed/inline-supplementary-material-1.jpg?download=true)
(A-C) Multiple observer Bland-Altman plots for interobserver variability of naked-eye-assessed CR time in seconds shown by profession, with each figure/form representing one observer. The 95% limits of agreement with the mean of all observers are shown as dotted lines. CR, capillary refill.
Discussion
In this study, we found a poor correlation between naked-eye assessment of the CR time and qCR time measures in both laymen and clinical staff. Further, we observed poor naked-eye intra-observer repeatability and interobserver agreement by clinical staff in their assessment of CR time. The use of a categorical evaluation of time measurement did not improve agreement between naked-eye estimations and machine-derived classifications.
It is self-evident to most clinicians that different observers, not only in regard to the CR test, often disagree in clinical assessments based on naked-eye observation.24 Previous studies on the reliability of the CR test have partially addressed this by showing a lack of interobserver agreement, but neither performance on the task to actually determine ‘return to normal’ skin colour, nor the intra-observer repeatability for a group of observers on a standardised set of cases has been assessed previously.11 28 29
We have added the use of an objective technique to determine restoration of skin redness and applied this as an external reference for the performance of naked-eye observations of the capillary refill process. Specifically, we have previously suggested tRtB1 as a quantitative endpoint that corresponds to the clinical ‘return to original colour’ with the rationale being that the technique allows determination of the exact point in time at which skin redness rendered by dermal erythrocyte concentration is restored to the same level as prior to the application of blanching pressure.15 30 31 Since naked-eye observation may more closely reflect the hyperaemia seen after blanching than the actual return to baseline, we also compared the CR time for naked-eye assessments to the maximal redness achieved (tPk). The tPk measure, however, correlated even less well to ‘return to normal colour’, suggesting that the observers did not try to estimate the same phenomenon (hyperaemia) that was shown by the qCR curve. Arguably, the findings in this study represent differences in sense of time, rather than an inability to assess the visual dynamics of the CR reaction. For this reason, we also asked the observers to categorise the refill responses as fast, normal or slow. These categorical classifications based on naked-eye observations were then compared with classifications based on qCR values, showing a slightly better agreement than time-based estimations. Categorical estimation only improved intra-observer repeatability slightly.
These findings show the difficulty in achieving reproducibility in a seemingly simple visual assessment even among clinical staff in an ED. Further underscoring the difficulty in being precise in naked-eye CR assessment, we found no obvious difference in precision of laymen and healthcare professionals in estimating CR time or performing categorical assessments. No studies have compared naked-eye assessments with an objective method quantifying skin redness. Studies of technical devices measuring CR time on fingers show similar qCR times as for naked-eye assessments according to literature but direct comparisons with naked-eye assessments have not been performed.17 32 The lack of consistency both between naked-eye observations and qCR, and between individuals and repeat assessments with the same individuals over time suggests that the naked-eye method for determining CR time estimation, as it is currently performed, is unreliable.
The usefulness of the CR test for the assessment of circulatory status in patients is, indeed, a recurring topic of debate.11 12 33 34
Taken together with previous studies on the questionable reliability of the CR test, the findings of this study indicate a need to revisit the role of CR time estimation in several globally implemented concepts for the assessment and monitoring of emergency patients, such as ATLS, APLS and paediatric early warning score. The findings also underscore the need for more research on the underlying physiology of this test, in order to establish reliable and reproducible methods for measurements that are coupled to relevant outcomes for specific patient groups and situations.
This study has some limitations. At present, there is no technical criterion standard for quantified assessment of the CR test. Polarisation spectroscopy which focuses on red blood cells in the dermis is a possible candidate to quantify return to normal colour in the CR time test by quantifying tRtB1 or other components derived from the qCR curve. Since there are no accepted, validated definitions of return to normal colour and no criterion standard for qCR time, we were unable to check the veracity of our chosen endpoints. The naked-eye assessments were made based on videos, which arguably may differ from some clinical situations. The study was performed in only one centre and the sample size was not large, but the conclusion on the poor performance of naked-eye assessment is still clear. Possible effects of changing the order of the videos were not studied. The videos were not augmented by other clinical information as would be the case in clinical real life, but the objective of this study was to isolate the actual skill involved in CR time estimation. Another limitation was that observers gave the time estimates and categorical estimates at the same time after watching the video, which raises the possibility that the observers’ own estimation in seconds may have influenced the categorical estimation rather than being independent. A large proportion of the observers changed naked-eye time estimates and categorical estimates in repeated observations, which indicated lack of consistency with the qCR-determined categories.
In conclusion, the ability of both healthcare professionals and laymen to assess the time for return to normal colour was poor when compared with qCR time measures. Intra-observer repeatability was low, as well as interobserver agreement. CR time measurement should ideally be performed by a quantitative method rather than by naked-eye assessment.
Supplementary file 2
References
Footnotes
Contributors DBW and RTJ conceived the study. DBW, RTJ and JH designed the trial. DBW obtained research funding. DBW and CDA supervised the conduct of the trial. RTJ and JH undertook recruitment of observers and managed the data with assistance from DBW. DBW and RTJ drafted the manuscript, and all authors contributed substantially to its revision. RTJ takes responsibility for the paper as a whole.
Funding This work was supported by two grants from Region Östergötland to author DBW (LIO-532001 and LIO-700271).
Competing interests RTJ and DBW have no conflicts of interest to declare. The bioengineering method TiVi is marketed by the company WheelsBridge AB. No financial support from WheelsBridge AB was involved in the conduct of the study. JH is employed by the Östergötland County Council but has a royalty agreement with WheelsBridge AB. CDA has a full-time academic position but also limited involvement in WheelsBridge AB.
Ethics approval This study was reviewed and approved by the Regional Ethical Vetting Board in Linköping, Sweden (permit number M200-07).
Provenance and peer review Not commissioned; externally peer reviewed.
Patient consent for publication Not required.