Article Text

Abstract
Background Prolonged wait times prior to triage outside the emergency department (ED) were a major problem at our institution, compromising patient safety. Patients often waited for hours outside the ED in hot weather leading to exhaustion and clinical deterioration. The aim was to decrease the median waiting time to triage from 50 min outside ED for patients to <30 min over a 4-month period.
Methods A quality improvement (QI) team was formed. Data on waiting time to triage were collected between 12 pm and 1 pm. Data were collected by hospital attendants and recorded manually. T1 was noted as a time of arrival outside the ED, and T2 was noted as the time of first medical contact. The QI team used plan–do–study–act cycles to test solutions. Change ideas to address these gaps were tested during May and June 2018. Change ideas were focused on improving the knowledge and skills of staff posted in triage and reducing turnover of triage staff. Data were analysed using run chart rules.
Results Within 6 weeks, the waiting time to triage reduced to <30 min (median, 12 min; IQR, 11 min) and this improvement was sustained for the next 8 weeks despite an increase in patient load.
Conclusion The authors demonstrated that people new to QI could use improvement methods to address a specific problem. It was the commitment of the frontline staff, with the active support of senior leadership in the department that helped this effort succeed.
- quality improvement
- emergency department management
- triage
- performance improvement
- change ideas
Statistics from Altmetric.com
Introduction
Long patient wait times and emergency department (ED) crowding are a problem in many countries. Quality of care is broadly understood as having six dimensions—safety, patient‐centredness, timeliness, efficiency, effectiveness and equity.1 Long ED waiting times impact at least three of these quality dimensions—safety, timeliness and patient-centredness. Studies have shown ED waiting times and overcrowding adversely impact clinically relevant processes and outcomes.2–5 In addition, prolonged waiting times also lead to patient dissatisfaction and poor experience of care.
EDs in low-income and middle-income countries (LMICs) face various challenges related to documentation, data, triage efficacy, equipment, human resource management, organisation of care and training. Literature on improvement efforts for emergency medical care in LMICs is scarce. In a 2015 systematic review of emergency care in 59 LMICs, only 25 studies (13%) out of the identified 195 studies described the impact of an intervention, remaining were mostly descriptive reports of the EDs.6
However, a small number of studies from LMICs have shown that simple improvements in patient flow and communication can reduce waiting times and improve patient satisfaction in the ED.7–9
The All India Institute of Medical Sciences (AIIMS), New Delhi is one of the largest tertiary care government hospitals in India. The general adult ED manages both surgical and medical emergencies. This excludes trauma patients, paediatric emergency cases and obstetric and gynaecological emergencies, which are directly managed in other specialised emergency units and centres.
The triage room at the adult ED is staffed by two resident doctors, two nursing officers, four health assistants (staff members responsible for patient transport) and four security guards. Unlike most high-income countries where triage is done by a triage nurse, at our ED (and in most LMICs) it is the doctors who primarily do triage with support from the nurses. The doctors staffing the ED are usually junior residents, backup support is available from emergency medicine (EM) specialty-trained physicians.
More than 400 patients are seen daily at the general adult ED at AIIMS. With such a large number of patients attending the adult ED each day, we were struggling to triage patients promptly; this led to the crowding of patients outside the triage area.
Due to space limitations at our hospital, there is no seated indoor waiting area for ED patients awaiting triage. We were worried about the patients waiting outside as failure to provide timely patient assessment compromises patient safety. Also, during the summer months of May to August when temperatures in New Delhi can be as high as 45°C (114 F) waiting in the open sun could further worsen the condition of patient due to heat exhaustion and dehydration. Anecdotally, patients would sometimes be waiting for hours before they were first assessed by any triage staff. This led to verbal disagreements between patients and staff members. The staff working in the triage room showed signs of burn out, frustration and dissatisfaction. There is no formal complaint and feedback system at our ED, so we do not have data on patient satisfaction. However, it was clear to us based on our daily experience of working in the ED that high waiting times were causing a lot of stress for patients, families and staff. We therefore started a quality improvement (QI) initiative to reduce the waiting time to triage.
Methods
Discussions to decrease waiting times were held with ED staff at all levels. A multidisciplinary QI project team was formed. The team included frontline staff currently posted at triage—two mid-grade nurses, two junior resident physicians and two health assistants. Additionally, two consultants from Department of Emergency Medicine and two senior nursing officers with administrative roles were included in the team to provide leadership support. The team lead was one of the mid-grade nursing officers posted in triage and was enthusiastic about solving the problem.
The QI team members were trained using the WHO South-East Asia Regional Office (WHO SEARO) Point of Care QI methodology.10 The QI team members met at least once every 2 weeks and also formed a WhatsApp group to communicate more frequently. The aim of the QI project was defined - to reduce the median waiting time of patients outside the triage area from 50 min to <30 min within 4 months from 1st April 2018 to 31st July 2018. The target of 30 min was chosen because team members felt that this was an achievable objective for the team in the given time frame.
The team used process flow diagrams and fishbone analysis10 to identify various causes for long triage waiting times. Based on the causes identified in the analysis the team came up with change ideas. The change ideas were tested using the iterative plan–do–study–act cycles (PDSAs).10 It was not always possible to test every idea separately given that the problem was acute and we needed to work fast to streamline the processes. Change ideas were first tried for a short time and on a small scale to learn if they were feasible. Changes that were feasible to do in the given context and had the potential to lead to a reduction in waiting times were implemented.
Measurement
The challenge of most QI efforts is to minimise the data collection burden while still having sufficient data to guide the improvement efforts. We wanted to ensure that the measurement strategy used did not cause unnecessary burden and was sustainable. The value of small sample sizes in QI has been described by other authors.11 Small sample sizes are especially useful where observed system performance falls far short of the desired performance and large changes in performance are to be identified.
Although our ED has an electronic health record system at registration it does not collect patient data before reaching and in the triage area. We use a a paper-based system in triage where clinical staff manually enter the information into registers.
To calculate the waiting time to triage, we used two data points. First, we collected data on when the patient arrived outside the ED and started waiting (T1). Second, we recorded the time of first medical contact inside the triage room (T2). The difference between these two data points (T2 – T1) gave the waiting time to triage for the patient.
We devised a simple system to collect the required data. Health assistants are staff members posted outside triage. Their role is to help with patient transport. Data collection sheet was given to the health assistant posted outside the ED to note down the arrival time of patients to the ED (T1).
Inside the triage room, a register was already used routinely for all patients who were assessed. The name, date, time of initial assessment and the brief presentation history are noted here. So, data on T2 (timing of initial triage assessment) were readily available for all patients coming to the triage.
The frequency of data collection and the sample size was by convenience and opportunistic. Data were collected twice a week, between 12 and 1 pm. This time frame was chosen as this was usually the peak time of patient crowding outside the ED based on the experience of the QI team members. The specific days of the week varied based on the convenience of team members. Data were plotted on a run chart. To keep data collection to a minimum, we collected data for only 20 patients per day. On two occasions the team was not able to collect data from 12 to 1 pm and collected data from 3 to 4 pm instead. T1 was noted by the health assistant posted outside the ED. T2 was later collected from the register by other team members. T2 minus T1 was calculated as the waiting time to triage.
Data analysis
We used run charts to analyse the data. We used the median as our measure of central tendency instead of using the mean as the median is less susceptible to outlier data. The median was recalculated when a shift was identified in the data using rules to define a shift as described by Anhøj and Olesen.12 A shift is ≥6 consecutive data points on the same side on the median.13 The baseline median was calculated from the first 10 data points from 11th April to 15th May 2018. As a balancing measure, we also collected data on the patient load during the time to account for any confounding on the waiting times from changes in patient load.
Understanding the processes of care
The next step was to understand the processes of care to identify changes we could make to reduce the waiting time to triage. The QI team drew a process flowchart (figure 1) to study the flow of the patients after arrival to the ED. Our triage system uses a simple red, yellow and green classification system. Red patients are the sickest needing immediate care, yellow patients need ED admission but are able to wait, green patients are those who do not need admission to the ED and can be given required treatment/advice at triage and sent home. In addition to these categories, an additional category of ‘fast track’ patient is kept for patients with shock, acute coronary syndrome and stroke; these patients bypass the registration process and are immediately transferred to treatment areas.
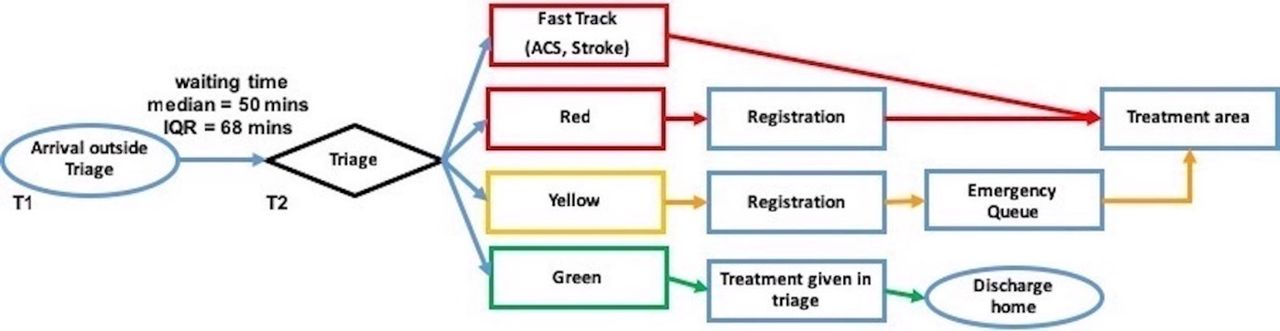
Simplified flowchart describing the ED flow. ED, emergency department; ACS, acute coronary syndrome.
The process flowchart made it clear that to reduce waiting times outside the ED, there should be an efficient triage system in place with rapid transfer of patients out of the triage area into appropriate queues.
The QI team also performed a cause and effect (fishbone) analysis to analyse different problems leading to delays. Several problems were identified and categorised under four headings—people, place, process and policy (table 1). The analysis helped the QI team come up with several change ideas which were tested using PDSA cycles.
Problems identified using the fishbone analysis
Strategy
The QI team came up with several change ideas to reduce the waiting time to triage and used PDSA cycles to test these change ideas. Change ideas were mainly focused on (1) orienting all cadres of staff on triage and its importance, (2) improving the knowledge and skills of staff posted in triage, (3) reducing turnover of triage staff and changing rotation systems to allow an overlap of experienced and new staff and (4) reducing wasteful documentation activities.
Some of these ideas worked well and were made part of routine practice and some did not work well or were not feasible, so they were abandoned. Here we describe each of the changes that were tried and which worked well and which did not. It was not possible to document the impact of each change idea separately as some were implemented in parallel.
Orientation session with nurses, doctors, technicians, health assistants and security guards
The project was initiated by organising an orientation meeting with the team and the other staff members involved in triage including the doctors, nurses, technicians, health assistants and security guards. This first step was to understand the problem from different perspectives, motivate the team, get everyone involved and share our vision for the ED triage. This session was held on 23rd April 2018; it was the first time that all cadres of team members were in one room. The session was well attended, though all the ED staff could not attend due to shift duties. The meeting was led by a faculty member in the presence of other senior faculty members who addressed the issues in the department one by one and their possible solutions. Involving health assistants and security guards in a discussion led to a better insight into the situation and also motivated them. The need for a team approach was explained and it was emphasised how important each member is for the system to improve. Empowering frontline staff and engaging them through effective leadership was probably the single most important step to create awareness and cultivate a culture of patient-centredness.
Refresher on correctly and quickly identifying the sickest patients (red triage protocol)
We began by trying out simple ways to improve the knowledge of the triage staff. We decided to only focus on the essentials. We did a quick refresher training of the red triage protocol. This protocol was designed to help triage staff to quickly and correctly identify the sickest (fast track and red category) patients. One member of the QI team introduced this protocol to triage staff during their morning shift in a 20 min group discussion. This was tested in two shifts on 23rd and 26th April 2018. Addressing the knowledge and skill gap was important to empower staff and enhance motivation. The average waiting time to triage for teams that were taught the triage protocol was 20 and 14 minutes on the same days. This was a major improvement from baseline. However, we realised that it was hard to do this orientation during work shifts as there was a frequent interruption for clinical care. So, we decided to do these short onsite training only during the start of the morning shifts when the patient load was much lower.
Formal triage training with first responder course for all ED staff
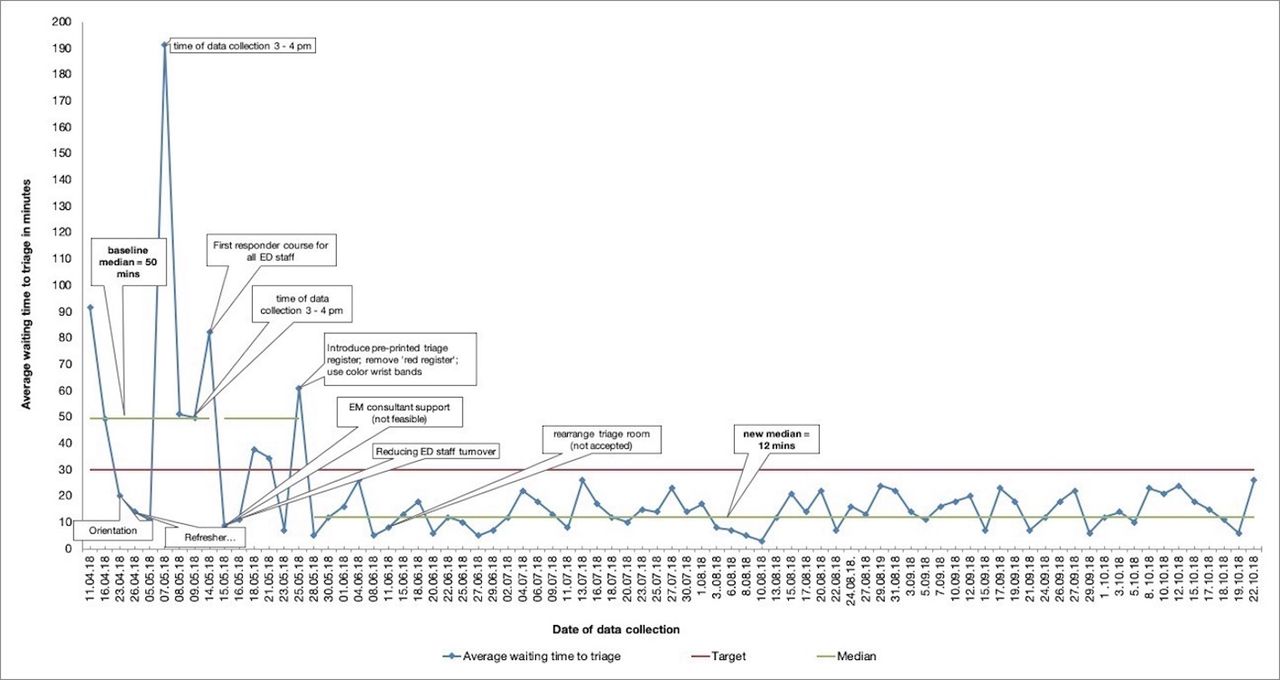
Another change idea was to conduct a first responder course for nursing staff, health assistants and security guards posted in the triage area. This was a half-day programme aimed at identifying sick patients, introduction to the concept of triage and the action to be taken in specific circumstances. Two training sessions were conducted on 11th and 14 th May 2018. The waiting time data on 15th May showed reduction in average waiting time outside the ED to an average of 9 min for that day (figure 2). Regular weekly and then bi-weekly triage training sessions were scheduled thereafter.

Run chart of average waiting time to triage*. *Each data point is the average waiting time to triage of 20 patients. Collected between 12 and 1 pm, except on 2 days as annotated. ED, emergency department; EM, emergency medicine.
Providing extra EM consultant support during peak hours
Some studies have shown that placing an EM physician at triage leads to significant reductions in the waiting times.14 15 We tested the impact of having an extra consultant in triage during the busy time of 11 am to 1 pm on 15th May 2018. The wait time to triage dropped to <10 min during this PDSA. This was a successful change idea but could not be implemented consistently because EM physicians were not always available to support triage.
Reducing nursing turnover in the triage team
Lack of fixed staff has also been identified as an important challenge in patient safety by the Seventy-second World Health Assembly of WHO.16 In our department, the nursing staff posted in triage were not fixed; the staff trained in triage would often be posted to other areas of care. Moreover, most junior nursing staff were posted in the triage room. To counter this problem, we requested the department nursing leader to design duty rosters specifically to allow nurses of all experience levels to be posted on rotation to the triage and set up a nursing triage team. Discussions for this were initiated on 15th April 2018 and the new system was put into place after 15th May 2018. We also requested that the roster be designed such that the nurses stay in triage at least 3 months before they are rotated to other areas. Also, we requested nursing staff be rotated in groups of 3, and not all 12 together, to allow an overlap of experienced and new triage nurses. The nursing leadership agreed to this proposal. However, despite fixing the roster the nursing staff continued to be randomly posted in other areas of the ED. The QI team continued discussions with the ED nurse superintendent and emphasised the need to reduce turnover of triage staff. Finally, it was agreed that due to a shortage of staff, three nursing officers will be rotated monthly rather than every 3 months as previously discussed. This was still an improvement over the random transfer of nurses. Fixing staff for a specific period of time led to the strengthening of our triage system. It also eased the implementation of change ideas.
Reducing turnover of health assistants posted in the ED
Just like the nursing staff, health assistants were also randomly rotated to and from triage. In parallel with the effort to reduce nursing turnover, a similar change idea was initiated to set up the health assistants’ team in the triage area. The ED administrators agreed to staff a fixed batch of 4–6 health assistants for 3 months in the triage room. Furthermore, it was agreed that not all health assistants would be changed at the same time, allowing an overlap of experienced and new health assistants.
Introducing preprinted triage registers
A paper register in the triage room is used to record basic patient information and the time of initial assessment. Before this QI initiative, the registers were blank, and triage staff had to manually enter the headings for each page and draw lines. This was a waste of staff time. Preprinted registers were procured on 24th May 2018. Senior nurse administrators were involved in this change idea and ensured that the registers were procured and the stock did not run out. This change saved staff time, eliminated unnecessary data recording and standardised data collection.
Removing duplicate documentation
We also identified non-value added activities. A ‘Red register’ was in use for documenting the basic details of red patients (those categorised as being most sick); previously, the health assistant transporting the patient to the treatment area had to take the Red register with him and obtain the signature of the receiving doctor. This process delayed the return of the health assistant back to the triage area. The data that were recorded in the ‘Red register’ was redundant as the same information was already in the triage register. Thus, the Red register was removed on 24th May 2018, allowing the quick return of health assistants to triage after the transfer of patients. The change idea was well received by the health assistants who found the use of Red register very tedious.
Introducing colour-coded wrist bands to provide quick visual cues
Colour-coded wrist bands were put in use to allow rapid identification of patients on 24th May 2018. A red band was placed on the wrist of critical patients. We decided not to use green and yellow bands as it turned out to be too time-consuming to put bands on all patients. This allowed easy identification of red patients and sped up the movement of critically ill patients out of the triage room.
Changing the arrangement of the triage room
The working table in the triage room was moved from its usual location at the entry of triage to the centre of the triage room on 12th June 2018. It was hypothesised that this rearrangement would improve patient flow. It seemed to be helping initially, but the triage staff did not find this relocation convenient, hence, the idea was abandoned and the table was moved to its original location.
Results
The baseline median waiting time to triage was 50 min (IQR 68), with a maximum of 191 min and a minimum of 9 min. Within 1 month of starting this effort, the median waiting time to triage fell below the target of 30 min. Using run chart rules a shift was detected starting on the week of 28th May 2018. The waiting time to triage remained below 30 min for the next few months, through the end of October 2018. The new median was 12 min (IQR 11 min) (figure 2). These improvements happened despite an increase in patient census. The monthly ED patient load at the start of this project in April 2018 was 8936 and this increased to >14 000 patients by October 2018 (figure 3), however, the waiting time at triage continued to fall during this period.

Total number of patients seen at the ED per month (April 2018–October 2018). ED, emergency department.
Lessons learnt
QI methodology was practical and effective in reducing waiting time to triage. We learned that selecting a problem that is visibly causing patient harm and discomfort is advantageous as frontline staff are motivated to solve it. Team effort is crucial to success. There is usually no one root cause of the problem. We have to address many factors to solve the issue.
We focused on small tests of change that were within the control of the ED team. For example, one of the causes for long ED wait times was inappropriate ED referrals from outpatient departments. We decided not to address this issue as it would require extensive interdepartmental coordination which would be challenging for the ED QI team. It was also not possible for us to increase the triage staffing levels. However, by working on other aspects such as minimising staff turnover, knowledge and skill development and reducing wasteful activities, we were still able to meet our aim of reducing waiting time to triage.
We learnt that a pragmatic approach to data can be enough to guide improvement efforts and that addressing both individual skills and system barriers are important.
Limitations
Specific change ideas which worked for us may not work for other EDs as some of the factors are contextual. It was not always possible to test each change idea one by one. Measurement timing, frequency and sample size were by convenience and opportunistic. Data on the duration of a patient awaiting triage were collected in the peak hours of patient crowding between 12 and 1 PM. As we wanted to minimise data collection burden, we do not have regular data from other times of the day. Thus, we do not know the effect of this intervention on unmeasured time points. Also, due to the lack of robust data systems in the ED, it was not possible for us to see the impact of this intervention on morbidity, mortality or total length of stay in the ED.
The activities performed to improve skills and knowledge were one-time activities. We are currently in the process of determining how to make regular training and skills development sessions for triage a routine part of the system. This will help sustain the improvement over time even as new staff join the ED.
Implications
ED services, especially non-trauma emergency services, have received little attention in LMICs. However, ED functioning impacts the whole hospital and can have immediate impacts on health outcomes.
It has been estimated that improvement of quality, access, efficiency and administration of timely emergency services can lead to a 45% reduction in mortality and a 36% reduction in disability in LMICs.17 It has also been documented that patients seeking emergency care (in LMICs) are generally young and free of chronic conditions.6 This observation also tallies with the general population that we see in our adult ED. Therefore, interventions to decrease mortality and morbidity in emergency settings of LMICs could dramatically increase life-years saved. ED efficiency is also important for any disaster response system. If the ED cannot handle regular work flow efficiently, then the system can collapse during any situation that leads to a sudden large influx of patients.
Based on our experience, we believe that other hospitals and healthcare teams can also improve the quality of care for their patients using similar improvement methods. The problem faced by our department will resonate with many other EDs, particularly, large public hospitals with heavy patient loads. We would encourage EDs facing similar challenges to use available resources and find innovative ways to improve care. The specific factors leading to delays in care and the change ideas will vary. But the QI methodology of identifying a specific aim, determining a simple measurement method, forming a team of frontline staff and trying several change ideas to resolve the problem can be followed in other settings.
Acknowledgments
The authors would like to acknowledge the Head of Department of Emergency Medicine, Dr Praveen Aggarwal for his immense support to this work. They also thank Dr Nigel Livesley for his review and providing useful inputs and the health assistant Mr Suresh and security guard Mr JK Singh for helping in the data collection effort and also to help organise training of staff.
References
Footnotes
Contributors AK: mentor and leadership in project, wrote first draft, edited and corresponded. DL: led data analysis and data collection. NJ: data collection and implementation of change ideas on the ground; organised training sessions for staff, facilitated negotiation with nursing staff. SV: data analysis and editing of manuscript, inputs for quality improvement methodology for this QI project. SB: conceptualised the whole project, taught and motivated triage staff, edited and reviewed the manuscript. AD: reviewed and edited the manuscript, gave inputs to improve methodology of the quality improvement project.
Funding The authors have not declared a specific grant for this research from any funding agency in the public, commercial or not-for-profit sectors.
Competing interests None declared.
Provenance and peer review Not commissioned; externally peer reviewed.