Article Text

Abstract
Background Long lengths of stay (also called waiting times) in emergency departments (EDs) are associated with higher patient mortality and worse outcomes.
Objective To add to the literature using high-frequency data from a large number of hospitals to analyse factors associated with long waiting times, including exploring non-linearities for 'tipping points'.
Methods Multivariate ordinary least squares regressions with fixed effects were used to analyse factors associated with the proportion of patients in EDs in England waiting more than 4 hours to be seen, treated and admitted or discharged. Daily situation reports (Sitrep), hospital episode statistics and electronic staffing records data over 90 days between December 2016 and February 2017 were used for all 138 English NHS healthcare providers with a major ED.
Results Higher inpatient bed occupancy was correlated with longer ED waiting times, with a non-linear association. In a full hospital, with 100% bed occupancy, the proportion of patients who remained in the ED for more than 4 hours was 9 percentage points higher (95% CI 7.5% to 11.1%) than with an 85% occupancy level. For each percentage point change in the following factors, the proportion of ED stays over 4 hours also increased: more inpatients with hospital length of stay over 21 days (0.07%, 95% CI 0.008% to 0.13%); higher emergency admissions (0.08%, 95% CI 0.06% to 0.10%); and lower discharges relative to admissions on the same day (0.04%, 95% CI 0.02% to 0.06%), the following day (0.05%, 95% CI 0.03% to 0.06%) and at 2 days (0.05%, 95% CI 0.04% to 0.07%).
Conclusions These results suggest that tackling patient flow and capacity in the wider hospital, particularly very high bed occupancy levels and patient discharge, is important to reduce ED waiting times and improve patient outcomes.
- research
- operational
- performance improvement
- emergency departments
- emergency care systems
- crowding
This is an open access article distributed in accordance with the Creative Commons Attribution Non Commercial (CC BY-NC 4.0) license, which permits others to distribute, remix, adapt, build upon this work non-commercially, and license their derivative works on different terms, provided the original work is properly cited, appropriate credit is given, any changes made indicated, and the use is non-commercial. See: http://creativecommons.org/licenses/by-nc/4.0/.
Statistics from Altmetric.com
Key messages
What is already known on this topic
Longer lengths of stay in emergency departments (EDs) are associated with higher patient mortality and worse outcomes.
Some evidence suggests that higher bed occupancy and a higher proportion of patients attending the ED who are admitted are associated with patient waits in EDs, but research has been based on short time periods, small numbers of hospitals or aggregated data.
What this study adds
Data from daily situation reports (Sitrep), Hospital Episode Statistics and Electronic Staffing Records over 90 days between December 2016 and February 2017, covering all major EDs in England, was used to assess the factors associated with patient lengths of stay in EDs.
Our study found that higher proportions of patients waited over 4 hours in ED to be seen, treated and discharged or admitted when bed occupancy levels were higher, potentially due to access block.
The association was non-linear; the relationship was observed when occupancy was higher than 88% and then accelerated above 92%.
In a full hospital, with 100% bed occupancy, the proportion of patients waiting over 4 hours in an ED was 9 percentage points higher than at an 85% occupancy level.
Higher numbers of long-stay admitted patients were independently associated with longer ED waits, potentially due to reduced bed flexibility.
These results demonstrate the important link between factors in the rest of the hospital and waiting times in the ED.
Introduction
Long stays in emergency departments (EDs) are associated with higher patient mortality and worse outcomes.1 2 However, with ageing populations and more complex conditions, patient demand for emergency care has been rising in many countries. This additional pressure on EDs makes it more difficult to keep throughput times short.
Several countries and regions, including England, Australia, Stockholm, Scotland and Northern Ireland, have implemented waiting time standards to measure and reduce the length of ED visits. In England, the National Health Service (NHS) constitutional standard is that 95% of patients attending EDs should be seen, treated and admitted or discharged within 4 hours.
After more than 5 years of deterioration, the proportion of emergency patients attending English EDs who spent less than 4 hours in the ED reached a low of 77% in the winter of 2018.3 There has been a strong focus on reducing the length of stay of patients in EDs (often called waiting times) and returning to compliance with the 95% constitutional standard. Identifying factors associated with longer patient stays is crucial to understanding where to target interventions.
Previous research highlighted the importance of bed occupancy4–7 and the proportion of patients attending the ED who were admitted into the hospital (the 'admissions conversion rate')7 8 on patient waits for emergency care in England. However, this research was limited by use of a short time period, or less often, aggregated data. For example, Cooke et al 9 identified a relationship between bed occupancy and the proportion of patients waiting for more than 4 hours, but only covered a single 2-week period in 2002. Keogh et al 8 analysed factors similar to those used in our study over a 4-year period, but their model’s explanatory power was limited by using annual data. High-frequency data are particularly important in studying emergency care as these are highly complex and fast-moving systems—the median time patients are in an ED is around 150 min10—meaning that quarterly or annual data can miss large daily fluctuations in patient waiting times, pressures and capacity.
Other studies that have used more granular data have shown links between time in ED and bed occupancy. In their systematic review, Morley et al 11 found that the inability to transfer a patient to an inpatient bed was cited as a major contributor to ED waits in all eight studies that considered this factor. In a study of one US hospital, Asaro et al similarly found that increased bed occupancy was associated with longer ED waits.12 Qualitative research with ED staff has also identified that lack of inpatient bed availability is perceived by ED staff as a major cause of waits in the ED.11
However, these studies have tended to be carried out using a small number of hospitals (typically one, up to a maximum five). This potentially limits the external validity of the findings and also limits the variation in the factors analysed. For example, Lucas et al 13 found no correlation between hospital-wide occupancy and ED waits, but the authors acknowledged that this could have been due to occupancy being low on the majority of the days they studied. This also highlights the importance of considering non-linear relationships when looking at bed occupancy effects.
The objective of this study was to use data collected daily from a large number of hospitals to add evidence on the range of factors that are associated with patient lengths of stay in emergency care—measured by the proportion of ED attendances that took more than 4 hours to be seen, treated and admitted or discharged—in England in winter 2016–2017. This analysis focused particularly on the effect of bed occupancy and types of inpatient. For bed occupancy, we studied whether there were non-linear effects on ED waits and potential 'tipping points' at very high occupancy levels.
Methods
Data
Our data were drawn from daily situation reports (Sitrep), hospital episode statistics and electronic staffing records (ESR). These databases allowed us to identify operational factors, patient characteristics and substantive ED staff. The data covered all 138 NHS Trusts with a major (type 1) ED in England, for each day between 1 December and 28 February in 2016–2017 inclusive. A type 1 ED is defined as having a consultant-led 24- hour service, with full resuscitation facilities and designated accommodation for the reception of accident and emergency patients. We focus solely on type 1 EDs due to the heightened acuity and time sensitivity of patients present.
Figure 1 describes how the data were cleaned to exclude missing or unrealistic values.

Observations included and excluded from the analysis. ESR, electronic staffing records
Study variables and transformation
Our dependent variable was the proportion of patients attending an ED each day who waited more than 4 hours to be seen, treated and admitted or discharged. This was chosen to be aligned to the most common metric of ED waiting times monitored nationally across all EDs in England. We categorised our explanatory variables into three groups: hospital factors, inpatient types and control variables. These variables were chosen based on a review of the existing literature on patient waiting times for emergency care5–7 14 and discussions with emergency care clinicians. Factors were included to cover the whole emergency care pathway, based on the hypothesis that the inability to admit patients from the ED into the hospital causes patient waits in the ED ('access block'), in addition to factors within the ED itself. All variables are daily and taken from hospital episode statistics, unless otherwise stated.
Hospital factors
We measured bed occupancy (using Sitrep data) as a percentage of general and acute inpatient beds occupied, in discrete 1% intervals (indicator variables). This is defined as a census snapshot taken at 08.00, with a count of (i) the number of beds open and (ii) the number of those beds occupied. Observations above 100% were therefore removed from the data.
We included an admissions to discharges ratio, calculated as the number of emergency admissions divided by the number of inpatients discharged from hospital on the same day. We used this variable to explore the mechanism of bed occupancy in more depth—this variable replaces bed occupancy in our second regression (model b). Our hypothesis was that the number of discharges relative to admissions may continue to affect the ease of admitting patients from ED in subsequent days. For example, it can be difficult to discharge patients at the weekend, which clinicians told us contributes to hospitals being more congested on Mondays.
We also included total admissions, defined as all elective and non-elective admissions on the day, to measure overall demand for hospital beds. We included a measure of senior doctors (monthly, ESR), defined as the proportion of the ED workforce whole-time equivalents, as recorded in the ESR for the month, who were medical staff in registrar grades and higher.
Inpatient types
We investigated two characteristics of the patients occupying beds in the wider hospital. To look at the effect of long-stay patients, we included the proportion of all inpatients with length of stay of 7 days or more who have stayed 21 or more days in hospital. This variable was constructed as a ratio to account for potential differences in average length of stay across healthcare providers and over time, driven by case mix and demographic differences. Our hypothesis was that long-stay patients may reduce the flexibility of the bed base, making it more difficult to admit patients from the ED.
Second, we looked at the proportion of beds occupied by patients with influenza, identified as those whose primary or secondary diagnosis code is J09–J12. Patients with influenza are often isolated from other patients, which can take out an entire bed bay and disrupt hospitals, including the emergency care pathway.
Control variables
Our controls include the size of the ED (monthly, ESR) measured through the total staff working in the ED (whole-time equivalents), the day of the week, week of the year and bank holidays. We also controlled for attenders’ characteristics, including gender and age mix of attenders and the proportion of attendances (i) that were self-referrals; (ii) that were from emergency services; (iii) with psychiatric conditions; (iv) for respiratory conditions and (v) with no investigation.
Control variables were chosen to account for wider factors that could affect ED waiting times, but which hospitals are less able to influence in the short term. These are in line with previous research.7
Large, persistent differences in ED waiting times were found between NHS Trusts. Some had very variable ED waiting times, whereas others remained steady—something noted in previous research.7 The factors that lie behind these differences among healthcare providers may include items that we cannot directly observe, such as culture, leadership or characteristics of the local population. We used statistical methods (a fixed effects regression) to control for these differences.
Statistical methods
We used multivariate ordinary least squares regressions with fixed effects.
Given the complex nature of the factors that influence ED waiting times, this allowed us to isolate the effects of each variable in turn, and to control fully for time-invariant differences between healthcare providers:
 (1)
(1)
where y a is the proportion of patients who spent more than 4 hours in an ED, X a variables of interest, z a control variables, u a is the error term and a i is the NHS Trust fixed effect. Each day is indicated by t and each NHS Trust by i.
We analysed two adaptations to the model. In model (a) we included indicator variables indicating the bed occupancy level in percentage points and the daily admissions ratio. In model (b) we omitted bed occupancy variables and the daily admissions ratio and instead included the admissions to discharges ratio (on the day and the two preceding days) and a measure of total admissions. We corrected for heteroscedasticity using clustered standard errors. As our dependent variable was strictly bound between 0 and 1, we checked the results against a fractional logit model with binomial family distribution. The statistical package STATA 13 was used for all analyses. A p value <0·05 was considered statistically significant. We used the STROBE (Strengthening the Reporting of Observational Studies in Epidemiology) case–control checklist when writing our report.15
Patient and public involvement
We did not involve patients or the public in our work.
Results
In winter 2016–2017, the proportion of ED patients nationally who waited over 4 hours varied between 13% and 31%, and across providers varied between 0% and 66%. Table 1 displays the results for the regressions. Looking at the R2 , the models account for up to 26% of the variation in the proportion of ED waits of over 4 hours. Our sample was a strongly balanced panel containing 12 420 observations, before removing spurious and missing data. Similar results were found using the fractional logit model (online supplemental appendix 1) .
Supplemental material
Results of the fixed effects multivariate regression
Hospital factors
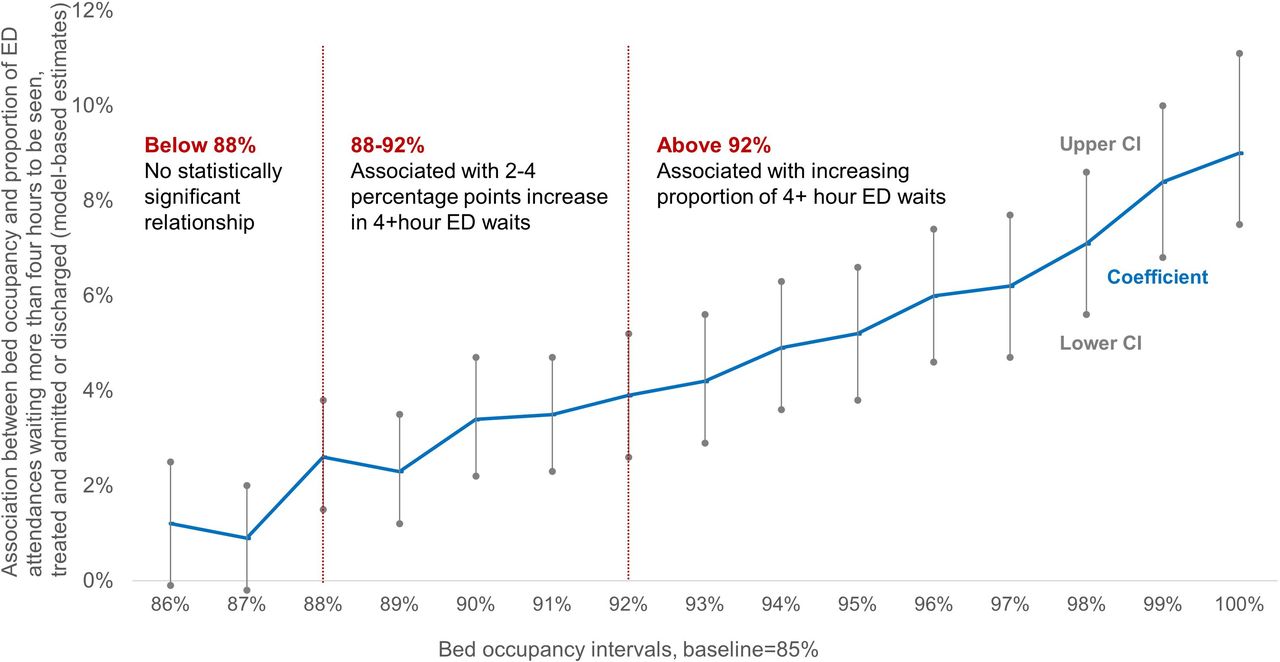
Higher bed occupancy levels had a non-linear association with ED waiting times. A higher percentage of beds occupied above 88% was associated with a greater proportion of ED patients waiting for longer than 4 hours to be seen, treated and admitted or discharged (figure 2), compared with 85%. Occupancy levels between 88% and 92% were associated with 2–4 percentage points more patients spending over 4 hours in EDs. Above 92% the magnitude increased for each additional one percentage point of bed occupancy. The largest effect was at 100% bed occupancy, which was associated with a 9 percentage point increase in the proportion of patients waiting over 4 hours.
To confirm the robustness of these findings we tested two alternative transformations of the bed occupancy variable: (1) a continuous variable and (2) three indicator variables for bed occupancy below 88%, 88%–92% and above 92%. Both alternatives confirmed the direction and magnitude of the association. Last, to have a baseline estimate of how strong the effect of bed occupancy would be without the other covariates we ran model (a) with the intervals of bed occupancy as the only explanatory variable, showing a strong and similar relationship to that of model (a). All these results can be found in online supplemental appendix 1.
Plot of the model-based estimates from model (a) showing the non-linear relationship between bed occupancy intervals and the proportion of patients spending more than 4 hours in emergency departments (EDs).
Higher numbers of emergency admissions were associated with more waits over 4 hours. A one percentage point rise in the ratio of emergency admissions on the day to the average emergency admissions for that ED across the whole winter period was associated with 0·08 percentage points more patients spending over 4 hours in EDs (table 1).
In model (b), we found that a lower ratio of non-elective admissions relative to inpatient discharges was associated with more ED patients waiting more than 4 hours both on the same day, as well as in the following 2 days. The effect on each day was about equal: a one percentage point increase in the ratio of non-elective admissions to inpatient discharges (indicating fewer discharges relative to admissions) was associated with a 0·04–0·05 percentage points increase in the number of patients spending more than 4 hours in ED (see table 1).
Inpatient types
In our analysis of inpatient types, we found among patients with length of stay of 7 days or more in hospital, that a higher proportion who had stayed 21 or more days was associated with more patients waiting over 4 hours in the ED. A one percentage point increase in the proportion of long-stay patients was associated with 0·1 percentage points more patients spending over 4 hours in the ED. We did not find a statistically significant association between the proportion of patients with influenza and length of stay in the ED.
Discussion
Summary of findings
By exploiting high-frequency daily data across winter, our analysis identified several factors associated with longer patient waiting times for emergency care.
Higher bed occupancy was associated with longer ED waits. A potential mechanism for this effect is access block, where 'patients in the ED requiring inpatient care are unable to gain access to appropriate hospital beds within a reasonable time frame'.16 Our findings suggest that this problem may become increasingly more pronounced above 92% and as occupancy levels approach 100%. This aligns with previous research,6 7 11–14 and more general findings that patients who are admitted to a bed in hospital wait longer in the ED than those who are not admitted.17
Our paper adds important understanding of this relationship by demonstrating that it is non-linear and identifying where tipping points lie, something highlighted as an area for future work in existing literature.8 These findings support efforts to reduce bed occupancy to improve patient waiting times in the ED, particularly very high levels of occupancy. With average bed occupancy hovering around 92% in England, this suggests that small changes in bed occupancy could imply significant changes in ED waiting times.
In addition to bed occupancy, our analysis found that an increase in the ratio of non-elective admissions relative to discharges increases ED waits on the day and also in the following 2 days. Moreover, inclusion of the admissions to discharges variable removed any explanatory power from our day of the week controls, which suggests that differences in the daily ratio between discharges and admissions may explain within-week ED waiting time variation. These findings emphasise the importance of maintaining discharge levels—for example, over weekends—to reduce ED waits in subsequent days.
Our analysis found that a higher proportion of long-stay patients (>21 days) was associated with longer patient ED waiting times. Long-stay patients may be more difficult to discharge quickly when there is additional pressure from the ED, as they often require social or community care or have multiple comorbidities,18 and this may affect bed flexibility.
Reducing the number of long-stay patients will become more challenging as health systems worldwide face ageing populations with more complex health needs. In England, long-stay patients may have a particularly large effect because they account for a disproportionately large amount of bed capacity—they comprised just 4% of patients but around 40% of total bed days.14 To tackle this, a new ambition was introduced—namely, to reduce the number of long-stay patients in NHS hospitals by 25% in advance of winter 2018–2019.19
Strengths and limitations
This study used daily data with wide coverage across all major EDs in England, to analyse the factors associated with longer patient waiting times for emergency care. Previous studies, which used annual data, shorter time periods or a smaller sample of EDs, captured less variation in bed occupancy and patient waiting times and so were unable to analyse the relationships at such a granular level.5 6 8 9 14 The statistical methods and robustness checks used should reduce potential bias and account for cross-healthcare provider heterogeneity.
We have been unable to include some factors in our research. For the workforce, we were limited to monthly data of substantive staff only, so did not fully capture daily staffing mix, agency use and shift-level patterns. Our healthcare provider-level analysis also did not account for the, sometimes large, differences between sites for healthcare providers with more than one type 1 ED.
The NHS in England has a specific 4-hour waiting time standard and relatively high levels of bed occupancy,20 which may limit the generalisability of the results. However, the general structure of emergency care provision is similar in many countries.21
Further work could also include other types of beds, such as critical care, mental health and community beds. There may also be benefits from obtaining even higher frequency bed data than daily. Fifty-eight per cent of NHS patients have a length of stay of 1 day or less,17 so use of beds changes substantially throughout each day. Splitting waiting times by admitted and non-admitted patients could add insight into the mechanisms by which bed occupancy is associated with ED waiting times, including whether the subset of patients who require an inpatient bed may be experiencing exit block.
Implications
Longer patient waits in EDs are associated with higher patient mortality and worse outcomes. By identifying and quantifying the relationships with long ED waits, our study suggests areas on which hospitals and systems can focus to improve ED waiting times. Our findings point to the importance of tackling capacity and flow in the wider hospital—including very high occupancy levels—and local health and social care systems to decrease the time patients spend in EDs.
Abstract translation
This web only file has been produced by the BMJ Publishing Group from an electronic file supplied by the author(s) and has not been edited for content.References
Footnotes
Handling editor Richard Body
Twitter @stevenpaling1
Contributors SP, JL, JC, JG-E and TA were all responsible for the conception and design of the study and interpretation of the data analysis. JL, JC and JG-E conducted the data collection and analysis. SP, JL, JC and JG-E were part of the writing committee. SP performed the literature review. TA reviewed the writing and analysis and provided comments. SP is guarantor.
Funding The authors have not declared a specific grant for this research from any funding agency in the public, commercial or not-for-profit sectors.
Competing interests None declared.
Patient and public involvement Patients and/or the public were not involved in the design, or conduct, or reporting, or dissemination plans of this research.
Patient consent for publication Not required.
Provenance and peer review Not commissioned; externally peer reviewed.
Data availability statement Daily winter Sitrep data are available in a public, open access repository: https://www.england.nhs.uk/statistics/statistical-work-areas/winter-daily-sitreps/. Hospital episode statistics may be obtained from the NHS Digital Data Access Request Service (enquiries@nhsdigital.nhs.uk) for users who meet their data governance standards. More information is available here: https://digital.nhs.uk/services/data-access-request-service-dars.