Article Text

Abstract
Background Unnecessary testing is a problem-facing healthcare systems around the world striving to achieve sustainable care. Despite knowing this problem exists, clinicians continue to order tests that do not contribute to patient care. Using behavioural and implementation science can help address this problem. Locally, audit and feedback are used to provide information to clinicians about their performance on relevant metrics. However, this is often done without evidence-based methods to optimise uptake. Our objective was to improve the appropriate use of laboratory tests in the ED using evidence-based audit and feedback and behaviour change techniques.
Methods Using the behaviour change wheel, we implemented an audit and feedback tool that provided information to ED physicians about their use of laboratory tests; specifically, we focused on education and review of the appropriate use of urine drug screen tests. The report was designed in collaboration with end users to help maximise engagement. Following development of the report, audit and feedback sessions were delivered over an 18-month period.
Results Data on urine drug screen testing were collected continually throughout the intervention period and showed a sustained decrease among ED physicians. Test use dropped from a monthly departmental average of 26 urine drug screen tests per 1000 patient visits to only eight tests per 1000 patient visits following the initiation of the audit and feedback intervention.
Conclusion Audit and feedback reduced unnecessary urine drug screen testing in the ED. Regular feedback sessions continuously engaged physicians in the audit and feedback intervention and allowed the implementation team to react to changing priorities and feedback from the clinical group. It was important to include the end users in the design of audit and feedback tools to maximise physician engagement. Inclusion in this process can help ensure physicians adopt a sense of ownership regarding which metrics to review and provides a key component for the motivation aspect of behaviour change. Departmental leadership is also critical to the process of implementing a successful audit and feedback initiative and achieving sustained behaviour change.
- audit
- emergency department
- quality improvement
This is an open access article distributed in accordance with the Creative Commons Attribution Non Commercial (CC BY-NC 4.0) license, which permits others to distribute, remix, adapt, build upon this work non-commercially, and license their derivative works on different terms, provided the original work is properly cited, appropriate credit is given, any changes made indicated, and the use is non-commercial. See: http://creativecommons.org/licenses/by-nc/4.0/.
Statistics from Altmetric.com
Key messages
What is already known on this subject
Depending on the healthcare setting, an estimated 20%–70% of tests and treatments are unnecessary.
Clinicians are aware of this but lack the tools and incentives to implement sustained behaviour changes.
It is important to reduce unnecessary tests and treatments in order to address rising costs and the threat to healthcare sustainability.
What this study adds
ED culture (including leadership), education and ongoing audit and feedback developedwith end users are key components of creating sustained behaviour change with respect to laboratory test use.
In our study, these factors contributed to a sustained reduction in unnecessary urine drug screen use in an ED
Introduction
Inappropriate use of laboratory tests has become a concern for healthcare systems around the world. The percentage of unnecessary tests and treatments provided to patients has been estimated to be anywhere between 20% and 70%1–4 in various settings. Rising costs attributed to unnecessary testing represent a major threat to achieving sustainable healthcare.5
Interestingly, healthcare providers seem to be aware that they are using tests unnecessarily.1 Researchers working in healthcare quality improvement have made extensive use of audit and feedback in efforts to modify clinician behaviour, including within EDs,6 and research is beginning to provide evidence about which audit and feedback methods work best.7 While there are a plethora of publications to indicate that audit and feedback promotes clinical behaviour change, few publications explicitly describe which aspects of audit and feedback (and local clinical culture) lead to successful and sustained behaviour change.
Locally, audit and feedback is used to provide clinicians with information relevant to their practice, although the process is rarely implemented using an evidence-based design. Generally speaking, static (ie, PDF) dashboards are distributed electronically; these documents may be reviewed by a department head and/or department members to determine if benchmarks for care are being met. The goal of this quality improvement project was to implement an audit and feedback intervention and create sustained behaviour change with respect to physician laboratory test ordering.
It is important to note that audit and feedback, even when optimally designed, should still be implemented using a behavioural model or framework to be most effective in modifying behaviour. The COM-B system (Capability + Opportunity + Motivation = Behaviour)/ behaviour change wheel is one such framework.8 The COM-B system recognises that behaviour is part of an interacting system that includes an individual’s capability, opportunity and motivation to perform that behaviour. The behaviour change wheel provides a framework of policy and intervention functions that can be implemented to affect behaviour.
We took an evidence-informed approach to the development and implementation of our audit and feedback tool: the clinician report. In collaboration with our local ED physicians, we developed a clinical dashboard with a dynamic interface, allowing end users to interact with their data. Following the initial report development, there was an 18-month period of education and group audit and feedback sessions with the aim of reducing unnecessary laboratory tests within the department. Our specific focus for this project was on reducing unnecessary use of urine drug screen tests.
Methods
Quality improvement
Quality improvement projects differ from classical research projects in a number of important ways. There is often no control group, but rather, metrics are compared over time through multiple ‘Plan-Do-Study-Act’ cycles where changes are implemented sequentially and data are reviewed as close to real time as is reasonable or feasible for the project.9 Because of this, data are often presented as run charts, showing data from small samples over time and using specific methodology to identify patterns in the data, which indicate shifts or trends.10 11 Finally, quality improvement studies are usually performed without an a priori hypothesis.
Choosing metrics for review
Development of the clinician report content began as discussions with the department head to better understand which metrics were to be targeted for improvement (see figure 1 for a timeline of events). Five laboratory tests were initially chosen based on anticipated high or unnecessary use, including blood tests for brain natriuretic peptide, erythrocyte sedimentation rate, C reactive protein, D-dimers and a urine drug screen (specifically, a rapid, lab-based test for substance screening, which provides general substance categories reported as positive or negative). Laboratory tests represented an ideal metric for a pilot project as the electronic data were readily available through the laboratory information system, providing access to relevant, current data for inclusion in the report.

Timeline of events in the development and implementation of the ED clinician report. The timeline of events is shown from initial discussions and development of the clinician report through the last audit and feedback session at the end of data collection for this manuscript. There were six audit and feedback sessions for the duration of this project, including the initial discussion and presentation of the clinician report in April 2018. The last audit and feedback session was held in October 2019 during which data were presented from January 2017 through September 2019, allowing for approximately 18 months of postintervention data to be reviewed and compared with 14 months of preintervention data. Graphic created using Time Graphics (https://time.graphics/).
Additional balancing and outcome measures (eg, length of stay, patient outcomes etc) were not collected as the focus of this project was on achieving sustained physician behaviour change regarding test ordering habits, and not on addressing the full scope of the benefits of this behaviour change to ED patients and processes. In addition, given the multitude of patient care factors that affect patient length of stay and other outcomes in the ED, reduced use of urine drug screen tests was not expected to affect any of these balancing measures. Based on clinician experience, there were no expected poor outcomes that would be associated with an appropriate reduction in urine drug screen use.
Behavioural model
We used the COM-B system and behaviour change wheel8 to guide our implementation of the audit and feedback intervention. The COM-B system provides a framework for understanding behaviour in which an individual’s behaviour is driven by interactions between their capability, opportunity and motivation to perform that behaviour. Capability refers to having the physical and psychological capacity to perform a behaviour, including the required tools, knowledge and skills. Motivation refers to the brain processes (eg, thoughts, emotions, beliefs, attitudes, analytical thinking etc), which direct behaviour. Opportunity is then everything external to the individual which may promote or inhibit a behaviour (including both social and physical environments).
The behaviour change wheel provides a framework of intervention functions that can be used to affect behaviour change; for example, to increase an individual’s motivation to perform a specific behaviour, one can implement interventions that enable the desired behaviour, provide training in performing the desired behaviour or coerce an individual to perform the desired behaviour. To address the capability, opportunity and motivation of individual physicians to modify their test ordering habits, several different functions from the behaviour change wheel were incorporated into the intervention. For example, the intervention included education on the use of urine drug screens in EDs (capability, opportunity), persuasion/coercion by the department head who strongly encouraged all department members to comply with the intended practice change (opportunity, motivation) and modelling within the clinician report that allowed physicians who were high users to see the test ordering habits of their peers and adjust their practice accordingly (capability, motivation). In addition, because clinicians have full autonomy over their test ordering, they have both the capability and opportunity to change their behaviour.
Educational intervention
Our main educational intervention focused specifically on reducing urine drug screen tests based on a Choosing Wisely Canada recommendation.12 Specifically, this recommendation targets psychiatrists and states: ‘Don’t routinely order qualitative toxicology (urine drug screen) testing on all psychiatric patients presenting to emergency rooms.’ Evidence indicates that routine ordering of urine drug screens for these patients can lead to false-positive or negative results and can delay psychiatric assessment and management.12 The ED physicians determined that this recommendation was relevant to their practice and they believed this test was being used regularly without providing clinically important information for the majority of patients. As a group, the physicians agreed that the goal would be to limit use of this test to cases where it was clinically necessary. Discussions among the physician group helped achieve consensus regarding clinical circumstances that would imply appropriate use. In practice, the target was to reach nearly zero urine drug screen orders from ED physicians. This target was based on the physicians’ judgement that there were very few patients for which this test provided meaningful clinical information for the purposes of treatment in the ED.
Clinician report development
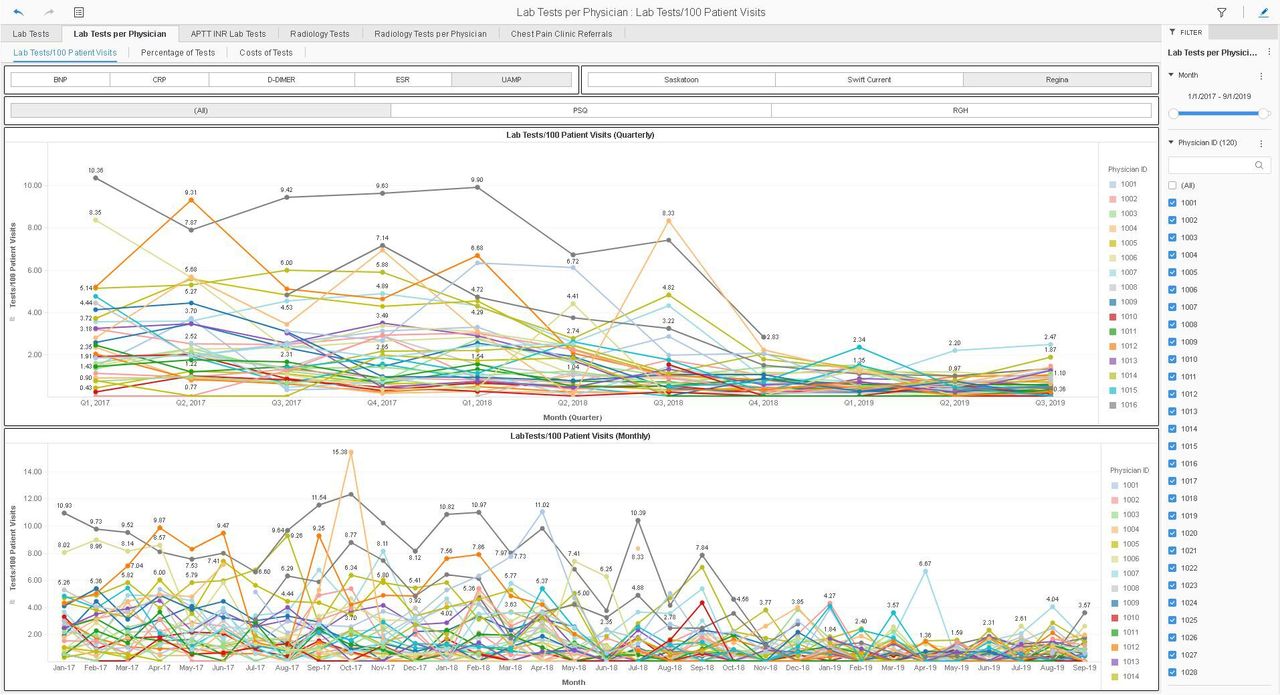
The report was created using the business intelligence software, MicroStrategy Desktop (V.11.1, MicroStrategy, USA; figure 2). One benefit of using such a tool is the inherent interactive interface that allows users to drill down into their data (eg, to specific events, time periods, individual providers etc). Electronic data were collected from the laboratory information system (ie, retrospective laboratory test orders from Jan 2017 through the most recent month) and electronic patient records (ie, monthly number of patient visits for each physician). Laboratory test use data were presented to physicians at the department level (as tests per 1000 patient visits) and individual physician level (as tests per 100 patient visits). Cost data were also presented (dollars spent based on the number of tests ordered at both the department and individual physician level); however, it was emphasised that this work was not intended to be a cost-saving measure, but rather, a method of promoting appropriate care. Physicians, in general, are sometimes weary of quality improvement projects as they can be associated with ‘cost-cutting measures’, which are occasionally forced on clinicians. Our team is careful to present our quality improvement initiatives with a focus on improving patient care, first and foremost. However, given the reduction in healthcare costs that accompanies many quality improvement projects and the impact that financial data can have on practitioner behaviour (particularly in a public healthcare system), we would be remiss not to present the financial data. In fact, the physicians in this particular group had requested cost data to be included in the clinician report. Data were generally presented as time series to allow for easy visualisation of changes over time. Data were presented for all five tests, but the focus of most audit and feedback sessions and the main educational intervention was specifically on the urine drug screen.

Example screenshot of the ED clinician report. An example time series showing the monthly number of urine drug screen tests ordered per 1000 patient visits for the entire physician group (ie, department-level data). The clinician report was designed and presented in MicroStrategy Desktop (V.11.1) allowing physicians to interact with their data in a more meaningful manner than with static PDF reports. Filters can be used to view data from different timelines, individuals or groups of physicians, different hospital sites, different tests and so on. Tool tips were created to provide more information on individual data points by simply using the mouse to hover over the data point.
Physicians were deidentified using a numeric code and individuals were asked to request their code from the Stewardship and Clinical Appropriateness Department to allow tracking of physician engagement. The report was first presented at a department meeting in April 2018 following a discussion of its development and the relevance of the included metrics. Audit and feedback sessions occurred approximately every 4 months (figure 1) to review progress towards goals and receive face-to-face feedback about the report. After each session, the report was emailed to the department head for distribution to physicians along with a ‘preamble’ document outlining the data, analysis and conclusions for those unable to attend the meeting. Thus, data were presented both in person and via an electronic file to physicians. MicroStrategy was installed on all departmental computers to ensure physicians could access the clinician report. The entire audit and feedback process was developed with both local end-user input as well as evidence from the literature.7
Setting and participants
This project involved the Saskatchewan Health Authority—Regina Area Department of Emergency Medicine physicians and the Stewardship and Clinical Appropriateness Department. The 52 physicians (39 initially and 13 more in the second year; medical students and residents were excluded) practised between two emergency rooms, one at each of the two tertiary care centres in Regina, Saskatchewan, Canada. Physicians attended a monthly department meeting, led by the department head, to discuss departmental initiatives. After the first year of the study, the department head transitioned out of this position and was not immediately replaced; additionally, department meetings were reduced in frequency to bimonthly. The Stewardship and Clinical Appropriateness Department consisted of a programme manager, research scientist and two research analysts, with combined experience in project management, data collection, analysis and presentation within the context of implementation science and behaviour change techniques.
Statistical analysis
Analysis of run charts was performed as per Perla et al 10 to determine whether there were changes in test ordering throughout the project. For final analysis, control charts (X chart, QI Macros, KnowWhere International, USA) were used to determine whether there were changes in the data, and paired sample t-tests (https://www.r-project.org/; https://www.graphpad.com/quickcalcs/) were used to compare the mean number of tests ordered per 1000 patient visits before and after the initiation of the intervention. Linear regression analysis was used to model predictions of test use before and after the intervention. The resulting regression lines were compared to identify statistically significant differences in the group means among the preintervention and postintervention groups after controlling for the effects of time (in months) using analysis of covariance (ANCOVA). Statistical significance was defined at p<0.05.
Ethical review
Ethical review was not sought for this project as it was initiated as an internal quality improvement pilot project; quality improvement projects are exempted from ethical review by the local research ethics board. Nevertheless, all aspects of this work have adhered to both local and national standards13 for the ethical conduct of research involving humans. The manuscript was prepared following SQUIRE V.2.0 guidelines.14
Results
Physician uptake
It took approximately 6 months (two audit and feedback sessions after the initial presentation) for the entire first cohort of 39 physicians to request their deidentified number, indicating 100% engagement with the clinician report. This was accomplished via a request from the department head following the October 2018 session (figure 1) that all physicians who had not yet done so, request their identification number. During the second year of the project, another 13 physicians joined the department (beginning July 2019); however, only two requested their identification number; at this time, the department head position was vacant and we had only one final audit and feedback meeting with the department (at the end of the study in October 2019).
Reduced test use and costs
Overall, the audit and feedback process developed in collaboration with the ED physicians led to a statistically significant decrease in the monthly average number of urine drug screens and cost per 1000 patient visits (table 1). Prior to the intervention, the physician group averaged 26 urine drug screens per 1000 patient visits; this number fell to eight tests per 1000 patient visits following the initiation of the audit and feedback intervention (p<0.0001; table 1). In line with this, the average monthly dollar amount spent on urine drug screen tests ($C96.10 each) in the ED dropped from approximately $C15 400 per month preintervention ($C2465/1000 patient visits) to approximately $C5008 per month postintervention ($C790/1000 patient visits; table 1).
Comparison of the average monthly number of urine drug screen tests ordered, cost, and patient visits preintervention (January 2017–March 2018) and postintervention (April 2018–September 2019)
Notably, reductions in test use were also observed in three of the remaining four tests (brain natriuretic peptide, erythrocyte sedimentation rate and C reactive protein), although not as drastically as the reduction seen with the urine drug screen (data not shown). The D-dimer test was the only one that showed no indication of a reduction in use during the study period; this test also garnered the most disagreement among physicians about appropriate clinical use during their meetings. Data are not shown for these tests as they were not the focus of the main educational intervention.
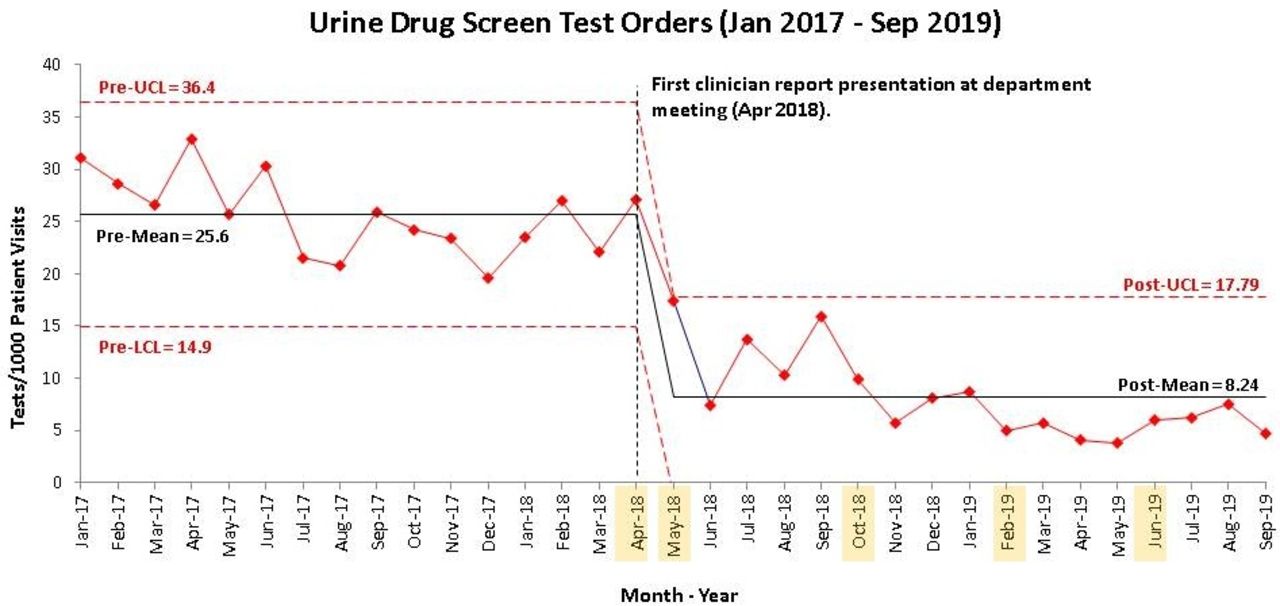
Control chart analysis
The above data are further corroborated when viewing the number of tests over time (figure 3). The initial decrease following the first audit and feedback session continued and a reduction in test use was sustained as we regularly met with the department to review their data (approximately every 4 months). The control chart in figure 3 shows this downward shift in the data from the preintervention period (January 2017 to March 2018) to the postintervention period (April 2018 to September 2019).

Reduction in urine drug screen test orders following audit and feedback intervention. The control chart displays the drop in the monthly number of urine drug screen test orders (per 1000 patient visits) following the initiation of the audit and feedback intervention in April 2018 (black dashed line). Red dashed lines indicate the upper (UCL) and lower (LCL) three-σ control limits. Highlighted months indicate audit and feedback sessions.
Regression analysis
Linear regression models were fitted for the preintervention and postintervention data (figure 4). Over time, an inverse relationship was observed between the number of tests ordered and time; thus, as time progressed, the average number of tests ordered declined. This was more pronounced in the postintervention period (p<0.05). A significant association between the audit and feedback intervention and a reduction in test use over time was observed. To increase the precision of comparisons between the preintervention and postintervention periods, an ANCOVA was employed to determine the effect of the audit and feedback intervention on the average number of tests ordered after accounting for variations in time. There was a statistically significant difference in the number of tests ordered between the two periods (F(1, 54)=69.73, p<0.0001). Post hoc analysis with a Bonferroni adjustment revealed that the average number of tests ordered in the postintervention period was significantly lower (mean=12.9; SE=1.86; 95% CI 9.19 to 16.6) when compared with the preintervention period (mean=34.5; SE=1.47; 95% CI 31.6 to 37.5; p<0.001).

Enhanced decrease in urine drug screen test use following an audit and feedback intervention. The red line indicates the number of urine drug screen tests per 1000 patient visits during the preintervention period (preintervention data for this analysis were extended to January 2015 to allow for better modelling with more data). The linear regression model is shown in orange. The dark blue line shows the number of urine drug screen tests per 1000 patient visits during the post-intervention period. The linear regression model is shown in light blue. The regression lines were found to be significantly different (p<0.05) and the model for the post-intervention period performed better as it explains a higher proportion of total variability in test orders resulting in a variability in time (adjusted R2=71%) as compared with the preintervention period (adjusted R2=71%).
Unintended effects
Anecdotally, we have received information about potential increased use of urine drug screen tests among psychiatrists. This effect of ‘squeesing the balloon’ is sometimes an outcome of quality improvement work where reduced test use by one group of physicians leads to increased use by another group.
Discussion
Overall, this project indicates that a clinician report designed and implemented as described herein can be a useful tool for providing audit and feedback and promoting successful clinical behaviour change among emergency physicians. There is much evidence to support the use of audit and feedback in various ED settings6 as well as optimal ways to implement audit and feedback,7 but many publications fail to describe the details of their intervention or of the culture within the department. We have attempted to capture these relevant pieces from our work to allow readers to make comparisons with their own ED culture and audit and feedback tools.
One strength of our work was the continuous involvement of end users throughout the development of the report, allowing our team to react to changing priorities and adjust the report based on their feedback. Others have also shown the utility of engaging end users in the design of audit and feedback interventions.15 16 Kobewka et al reviewed 109 studies for which an intervention was used to reduce test use and 103 did not involve the targeted physicians in creating and implementing the intervention.5 This indicates that many researchers are not involving end users in the development of their interventions. We believe that allowing physicians to have input regarding goal setting, metric selection and data visualisation contributed to sustained behaviour change (figure 3) by enhancing their engagement with the work. Based on the COM-B model, physician engagement helps address the motivation requirement for behaviour change.8
Another strength of the clinician report is the interactive nature of the document. It is common in our local context for clinicians to receive static, usually annual, reports of measures relevant to their department. While this provides clinicians with a snapshot of individual or departmental clinical performance, it remains difficult to uncover nuances in the data, gauge changes in performance over time or to measure the effect of improvement efforts over short time intervals. The ability to drill down into the data included in our report allowed physicians to engage more meaningfully and for the team to design better strategies for interventions. As a case in point, when the urine drug screen was initially introduced as a potential test for review, it was assumed that most physicians in the department were using this test more often than necessary. When the data were reviewed, it became apparent that there were only a handful of ‘high users’ that accounted for a higher than average number of tests being ordered (figure 5). This knowledge allowed the department head to have focused conversations with a few individuals instead of relying solely on broad knowledge dissemination in a group setting.

Identification of high users. An example time series showing the monthly number of urine drug screen tests ordered per 100 patient visits for individual physicians (ie, physician-level data). The clinician report allowed the team to identify specific individuals who were higher than average users of the test and focus an intervention towards these individuals.
One important reason for choosing MicroStrategy as the platform was the intent to provide the report online, which would eliminate manual distribution and requiring users to download additional software. We are currently developing the online report with our provincial information technology partner, eHealth Saskatchewan. The online report will allow for continual tracking of physician engagement rather than the current method of physicians requesting their identifier. Interestingly, even with the limitations of the current method of tracking engagement, we were able to identify two distinct populations within the first cohort of physicians (online supplemental figure 1). One population, the ‘early adopters,’ was those who requested their identification number early on (within the timeframe of the first two meetings). Online supplemental figure 1 shows that these physicians tended to have lower use of urine drug screen tests overall, even prior to the intervention, compared with the group of physicians who did not request their number until after the third audit and feedback session (‘latecomers’). Ivers et al reported a similar trend among early adopters in their work.17 This could indicate that early adopters represent a subgroup of physicians who are perhaps more familiar with the evidence surrounding urine drug screen use, more conservative in their approach to ordering laboratory tests or more inclined to use data to guide their clinical behaviour. Regardless, this information proved useful by, once again, providing a targeted group for the department head to approach to discuss the importance of reviewing the clinician report.
Supplemental material
The importance of the department head’s engagement in this initiative cannot be understated. The measures that were included initially were brought to our team by the department head on behalf of the emergency physician group. It was also through the department head’s actions that the initial cohort of physicians achieved 100% engagement. Additionally, since the department head stepped down, we have yet to achieve 100% engagement from the newest cohort of physicians, indicating the importance of having a champion within the physician group. The department head was also instrumental in leading discussions about setting appropriate goals and determining how to achieve them.
In addition to the engagement of the department head, it is important to engage as many members of the department as possible at all stages of the audit and feedback process. It is possible, for example, that not all physicians would prioritise the same set of laboratory tests for initial review and this may be reflected in the slow engagement of some individuals. Likewise, the low level of engagement from the second cohort may, in part, be due to their lack of involvement in the original planning that occurred prior to their recruitment, their involvement in only one audit and feedback meeting following their recruitment and/or the fact that they would have had only limited individual data to review in the data set. Of note, presenting cost data was viewed as another key aspect for engaging physicians in this work. The department head reported that physicians were shocked to learn the cost of certain tests; furthermore, he highlighted that presenting cost data was key in motivating physicians to be better stewards of the system in which they work.
An important point to highlight is that, despite the practical approach of having nearly zero urine drug screen tests ordered by emergency physicians, it is apparent that physicians continue to order these tests (although at a much reduced rate compared with preintervention; figure 3). Of course, there are clinical reasons to order these tests in the ED and the recommendation has been made for the next department head to review with the group what an appropriate number might be as a way of developing a benchmark. Additionally, we have reached out to the psychiatry department to gather their insights into the use of this test in the ED, especially since the Choosing Wisely Canada recommendation this work is based on is a recommendation for psychiatry.12 Initial conversations highlighted that psychiatrists often request a urine drug screen to provide evidence when there is disagreement with a patient about whether or not the patient has been using any substances of concern. This reasoning is not congruent with the best practice recommendation.
One further aspect to consider is the multitude of factors which can contribute to behaviour change in any quality improvement study. In this case, there were a number of physicians who did not request their deidentified number immediately and, it is therefore assumed, did not review their individual data in the clinician report (although they may still have viewed the report). Yet there was still a decrease in urine drug screen use among the majority of physicians (figure 5). It is possible that other factors, for example, being part of departmental meeting discussions or having informal conversations with colleagues could also play a role in encouraging clinical behaviour change among individuals. Thus, while the project reported here describes factors that can be considered when developing an intervention for curbing unnecessary laboratory test use, it should be noted that all aspects of our approach may not be necessary or sufficient on their own.
The main limitation of this work is that it is a single centre study. Due to this being a pilot project, we did not reach out to other sites throughout the province for engagement; however, the work to include EDs from other centres is currently underway. There was no control group but, given the interventional design of the study, a control group would not likely be appropriate. Since we focused on the Regina Area, and emergency physicians in this Area work at both tertiary care centres and attend the same department meetings, it would have been difficult to design a study in which there was a control group. Notably, the group of early adopters indicated in online supplemental figure 1 provides some insight into the differences which may be seen in a control group (ie, the lag time for the latecomers to reach the same reduced level of test use). One final limitation is that we did not collect balancing measures; however, it was not anticipated that reducing the use of urine drug screens on their own would reduce measures, such as length of stay, or contribute to increased patient harm.
In conclusion, an audit and feedback intervention designed with ED physicians, which uses an interactive dashboard and follows guidance from published literature surrounding audit and feedback and behavioural science,7 8 can help reduce unnecessary test use among ED physicians. While our efforts, thus, far have focused on one test, future work will examine the use of the other tests for which we have been collecting and providing data in the absence of a direct educational intervention. Additionally, we will explore the use of urine drug screens by psychiatrists and delve into a qualitative assessment of the differences between early and late adopters of practice change in our local context.
Ethics statements
Patient consent for publication
Supplementary materials
Supplementary Data
This web only file has been produced by the BMJ Publishing Group from an electronic file supplied by the author(s) and has not been edited for content.
Footnotes
Handling editor Simon Smith
Twitter @JRobotPhD
Contributors JRV, SP, MLD, RP and TR contributed to the conception, design, and implementation of the study. MLD, IWA and SM provided data analyses. All authors contributed to the manuscript.
Funding The authors have not declared a specific grant for this research from any funding agency in the public, commercial or not-for-profit sectors.
Competing interests None declared.
Provenance and peer review Not commissioned; externally peer reviewed.
Supplemental material This content has been supplied by the author(s). It has not been vetted by BMJ Publishing Group Limited (BMJ) and may not have been peer-reviewed. Any opinions or recommendations discussed are solely those of the author(s) and are not endorsed by BMJ. BMJ disclaims all liability and responsibility arising from any reliance placed on the content. Where the content includes any translated material, BMJ does not warrant the accuracy and reliability of the translations (including but not limited to local regulations, clinical guidelines, terminology, drug names and drug dosages), and is not responsible for any error and/or omissions arising from translation and adaptation or otherwise.