Article Text

Abstract
Aim To create and validate a simple clinical score to estimate the probability of admission at the time of triage.
Methods This was a multicentre, retrospective, cross-sectional study of triage records for all unscheduled adult attendances in North Glasgow over 2 years. Clinical variables that had significant associations with admission on logistic regression were entered into a mixed-effects multiple logistic model. This provided weightings for the score, which was then simplified and tested on a separate validation group by receiving operator characteristic (ROC) analysis and goodness-of-fit tests.
Results 215 231 presentations were used for model derivation and 107 615 for validation. Variables in the final model showing clinically and statistically significant associations with admission were: triage category, age, National Early Warning Score (NEWS), arrival by ambulance, referral source and admission within the last year. The resulting 6-variable score showed excellent admission/discharge discrimination (area under ROC curve 0.8774, 95% CI 0.8752 to 0.8796). Higher scores also predicted early returns for those who were discharged: the odds of subsequent admission within 28 days doubled for every 7-point increase (log odds=+0.0933 per point, p<0.0001).
Conclusions This simple, 6-variable score accurately estimates the probability of admission purely from triage information. Most patients could accurately be assigned to ‘admission likely’, ‘admission unlikely’, ‘admission very unlikely’ etc., by setting appropriate cut-offs. This could have uses in patient streaming, bed management and decision support. It also has the potential to control for demographics when comparing performance over time or between departments.
- clinical assessment
- clinical assessment, effectiveness
- clinical management
- emergency care systems, efficiency
- triage
This is an Open Access article distributed in accordance with the Creative Commons Attribution Non Commercial (CC BY-NC 3.0) license, which permits others to distribute, remix, adapt, build upon this work non-commercially, and license their derivative works on different terms, provided the original work is properly cited and the use is non-commercial. See: http://creativecommons.org/licenses/by-nc/3.0/
Statistics from Altmetric.com
- clinical assessment
- clinical assessment, effectiveness
- clinical management
- emergency care systems, efficiency
- triage
Key messages
-
What is already known on this subject
-
Unscheduled admissions to hospitals are rising with increasing costs. Clinical judgement and various routine measurements such as NEWS scoring at the point of triage have been used to try to predict admission, but none to date has the utility to be adopted universally in a clinically meaningful way.
What this study adds
-
This study used routine collected data at triage for more than 500,000 emergency and urgent presentations over a two year period to hospitals in a large city to establish an admission prediction score and to validate it. The outcome, a simple 6 point score which accurately estimates the probability of admission from triage information may be applied to help improve patient pathways, prevent re-admissions and reduce costs.
Introduction
Unscheduled admissions to Scottish hospitals increased by 13.2% between 2005 and 2012, with an increase of 12.2% in England over the same period.1 ,2 Emergency department (ED) attendances have grown more rapidly, with English EDs seeing 19.9% more patients in 2011 than they did in 2005, a pattern observed elsewhere in the developed world.3 ,4
Rising ED attendances lead to higher costs, overcrowding and longer waiting times.1 ,5 Longer waits expose patients to worse outcomes, decreased satisfaction, and a higher chance of leaving before their treatment is complete.5 ,6 Without increases in staffing and facilities, the only way to protect waiting times is to optimise the use of existing resources.7 An accurate early prediction of whether patients attending the ED will require admission could promote efficiency in several ways, for example by allowing specialised work streams, facilitating decision support and assisting bed planning.7–12
Triage is usually the first clinical assessment that a patient has after arrival to the ED, but several studies conclude that triage personnel are unable to accurately predict admission using clinical judgement alone.13–16 More objective methods of predicting admission at triage or in the prehospital setting have been described using variables such as age, triage category and physiological early warning scores to estimate the probability of admission.13–21 Some of these methods are more accurate than clinical judgement alone, but none has been widely adopted, perhaps because the simpler tools are not accurate enough to be clinically useful, and others are too complex for routine use.
As well as its potential for improving efficiency, an admission prediction tool built on routine clinical data could have other uses. The case mix of patients presenting to EDs varies according to geographical location and time of year, and this makes it difficult to compare the practice of different units, or even to monitor the performance of a single unit over time. A reproducible measure of the probability that a patient will be admitted could control for differences in case mix. It could also help to provide a causal explanation for differences or changes in admission rates.
The aim of this study was, therefore, to create and validate a simple, objective, accurate and widely applicable clinical tool to estimate the probability of admission from the data already recorded in reception and triage.
Methods
Study aim and design
This was a multicentre, retrospective, cross-sectional study of routinely collected clinical data.
Setting and participants
All unscheduled adult attendances to hospitals in North Glasgow during the 2-year period from 21 March 2010 to 20 March 2012 were included. The period 21 March 2009 to 20 March 2010 was analysed to create an attendance history for patients presenting during the main study period. Data were collected from six individual units in three different hospitals comprising six unscheduled care centres which, between them, saw all unscheduled attendances in the area. These comprised three EDs, two medical Acute Assessment Units, and one Minor Injuries Unit. These units all used the same computer system to record routine data (Emergency Department Information System, iSoft, Sydney, Australia).
Variables
Response variable
Each attendance was categorised according to the eventual clinical decision made to admit or discharge. For this reason, patients who left before a decision could be made were excluded rather than being counted as discharges. Deaths in the department were counted as admissions, because it was inferred that the patients were so ill that a decision would have been made to admit them should they have survived.
Predictor variables
All variables recorded in reception and triage that had a potential correlation to admission were considered (see table 1). Physiological observations were combined using a common, validated, numerical prognostic marker: the NHS National Early Warning Score (NEWS).22 The units all used the Manchester triaging system (MTS), and this was included in the model.8 However, some units additionally used a ‘3+’ category for patients who were deemed most urgent among category 3 patients, but did not meet category 2 criteria.
Results of univariate analysis
Specific presenting complaints were not used as variables to avoid the need for patients to answer a long list of questions, which would slow down the triage process.8
Treatment of missing data and sources of bias
Data were extracted from a large database, and there were inevitably some data entry errors, duplications and omissions. All duplicate cases were identified and removed. Missing fields were, if possible, inferred from other data (eg, if sex was not recorded but the patient's name was Mary, female gender was assumed).
If missing data could not be inferred, the attendance was excluded from further analysis. Exceptions to this were made where the data were clearly missing for reasons that would also strongly affect the probability of admission. For example the sickest patients, with the highest probability of admission, sometimes bypassed triage altogether to go straight to the resuscitation room, and therefore their initial observations, though recorded, were not transcribed to the electronic triage records. In these cases, imputation of missing fields from matched cases was used to minimise bias.23 A summary of the treatment of missing data is given in table 2.
Handling of missing data
Statistical analysis
All statistical analyses were carried out in the R statistical programming language, V.2.13.1.24 The attendances were randomly assigned to two subgroups, with two-thirds being used for model derivation and one-third for validation.
The ability of each of the variables to predict admission was assessed using logistic regression. To ensure high statistical and clinical significance, only variables considered for further analysis were those with an OR of greater than 2 and a p value of <0.001.
These variables were entered into a multiple logistic regression analysis with stepwise deletion, using a mixed effects model to account for patients who had multiple attendances.18 The final score was then created by transforming the regression coefficients using normalisation and rounding.
The use of the score in predicting admission was tested by applying it to the validation sample, and analysing the resulting receiving operator characteristic (ROC) curve with a bootstrapping method using 10 000 replicates to calculate 95% CIs.25 The proportion admitted in the validation sample at each score point was compared to that in the derivation sample using χ2 tests.
Probability of reattendance
All patients retained in the validation group who had been discharged following their attendance were included in the secondary analysis. Their score was used as a predictor variable in a logistic regression analysis against the outcome of admission to hospital within 28 days.
Results
Dataset
Totally, 585 396 attendances were recorded during the 3-year period. After excluding the first year (used for attendance histories only), duplicate entries, patients under 16 years of age, cases with randomly missing data, and transfers between units, there were 322 846 attendances in 191 653 unique patients available for analysis. This represents an average of 1.68 attendances per patient over 2 years. Attendances were randomised to 215 231 for model derivation and 107 615 for validation.
Derivation of score
The results of the univariate analyses are shown in table 1. For each variable, the value associated with the lowest rate of admission was taken as the baseline value. The raw odds of admission are shown for the baseline value, and admission rates for other values of the same variable are given as an OR.
Statistically and clinically significant associations with the rate of admission were seen with triage category, increasing age, increasing NEWS score, transport by ambulance, referral by another healthcare professional, and previous admissions. These factors were all entered into the multivariate analysis.
Attendances on weekdays or in the out-of-hours period were more likely to produce admissions than presentations at weekends, but the OR was less than 1.5. Women were significantly more likely to be admitted than men, but again the effect size was small, with an OR of 1.2. These factors were, therefore, not included in the multivariate analysis.
The results of the multivariate analysis are shown in table 3. The factors entered into the model all retained statistical significance and a clinically important effect size. The coefficients of this model were used to create the final score (table 4).
Multivariate model
Admission prediction score
Performance of score in predicting admission
The area under the curve (AUC) of the ROC curve for the raw model tested on the derivation data was excellent, at 0.8778 (95% CI 0.8764 to 0.8793). Despite being rounded for simplicity, the derived score had an AUC that was not significantly smaller, at 0.8776 (95% CI 0.8762 to 0.8791).
The validation dataset gave similar results, with an AUC of 0.8774 (95% CI 0.8752 to 0.8796) for the derived score. To emulate real-world use, the ROC of the validation sample was also calculated without the cases where random imputation had been employed, and this had only a slightly smaller AUC, at 0.8723 (95% CI 0.8702 to 0.8745).
The goodness-of-fit tests showed no significant difference in admission rates for each of the score levels between the derivation and validation groups (p=0.524), suggesting a good fit of the empirical model to the data.
The graph of probability of admission for each score is shown in figure 1.
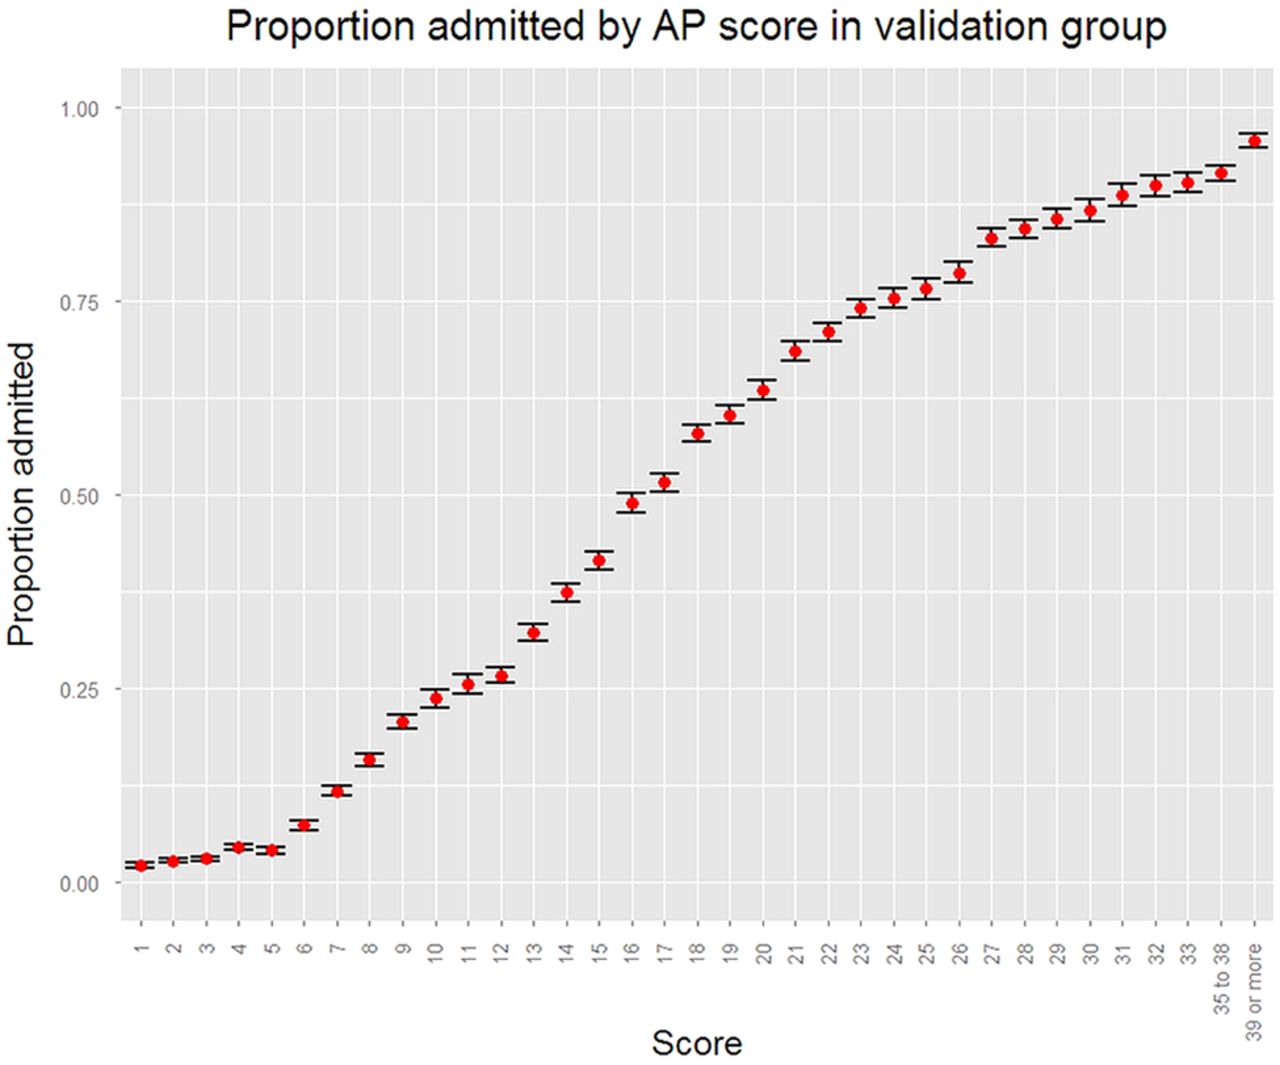
Probability of admission at each score point.
The score as a binary predictor
When used as a binary predictor of admission, the optimum cut-off of greater than 15 points correctly predicted the outcome of 80.3% of patients (95% CI 80.2 to 80.4%). This represents a 78.0% sensitivity (95% CI 77.8 to 78.2%) and 81.7% specificity (95% CI 81.6 to 81.9%) for predicting admission. The positive predictive value was 72.5% (95% CI 72.3 to 72.7%) and negative predictive value was 85.7% (95% CI 85.6 to 85.8%).
However, the score is unlikely to be at its most useful as a simple binary predictor. Defining high probability or low probability groups might be more clinically helpful. A ‘high probability’ score of >25 would allow over one-third of admissions to be identified immediately, at a cost of mislabelling less than 3% of discharges inappropriately. A score of less than 8 would allow over half of all discharges to be identified in advance, with less than 5% of admissions wrongly streamed to this group.
The usefulness of these specific examples might vary according to local demographics and workflows, so deciding on didactic cut-offs was purposefully avoided to prevent limiting the score's wider applicability.
Performance of score in predicting reattendance and admission
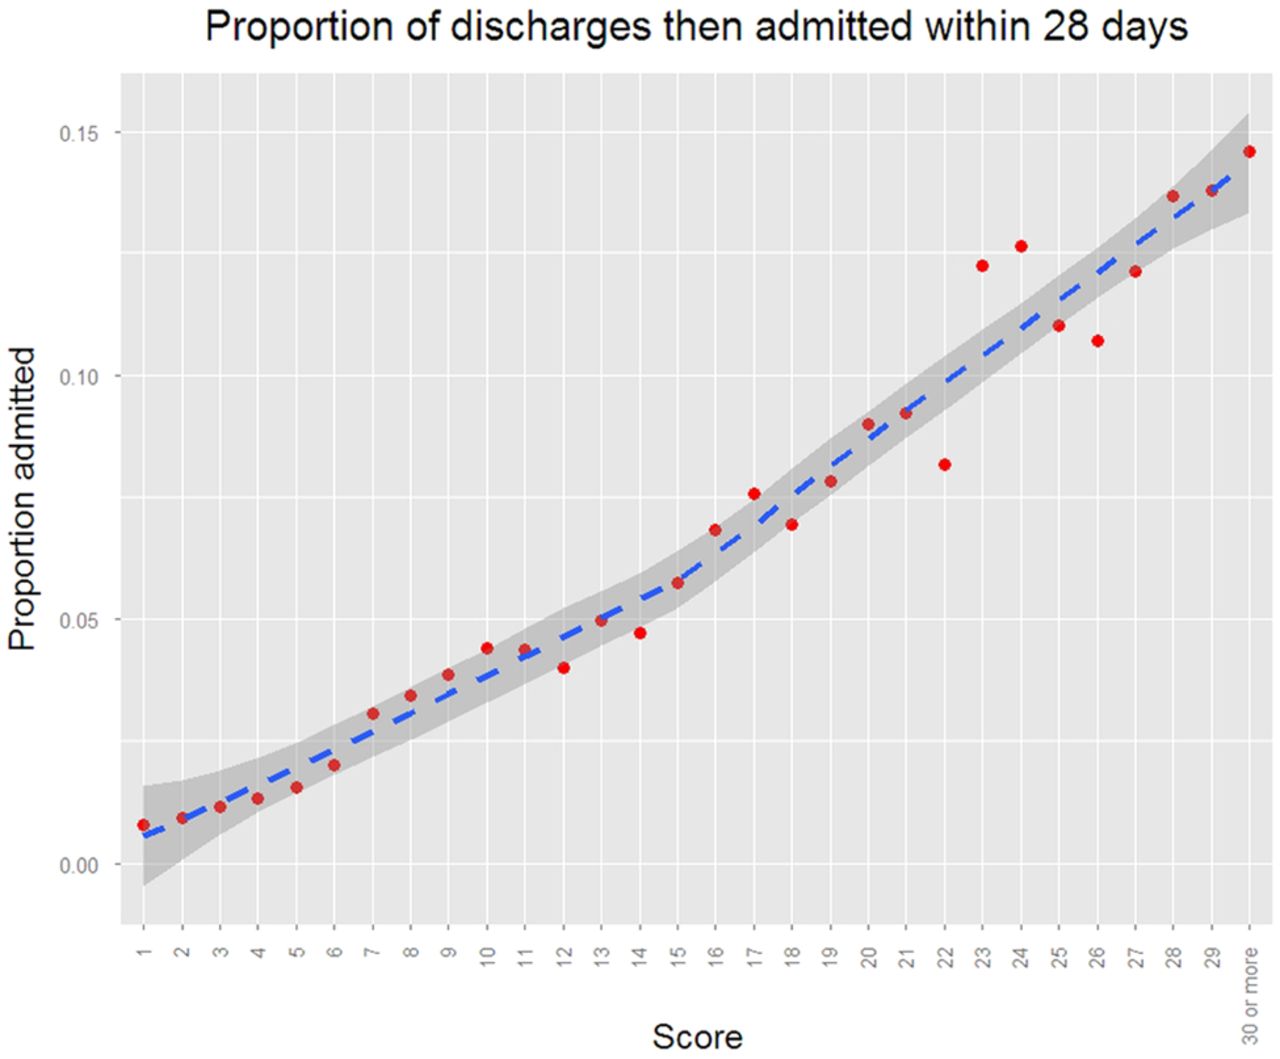
A plot of the scores of all patients discharged from the ED against their proportion admitted to hospital in the next 28 days shows a linear relationship (see figure 2). The positive relationship was confirmed by logistic regression analysis, with a 0.0933 increase in log odds of admission (p<0.0001) per point on the score confirming that patients with higher scores are more likely to be admitted to hospital, and if they are discharged they are more likely to subsequently return to hospital and be admitted.

Probability of being admitted to hospital within 28 days if discharged from ED.
To put this in context, the odds of a patient who is discharged with a score of zero being readmitted within 28 days is 80:1, but for every 7-point increase, the odds double, so that they are 40:1 with a score of seven, 20:1 with a score of 14, and 10:1 with a score of 21. At scores of 45 and over, the patient is more likely than not to require admission within 28 days. Such information may be useful to clinicians in supporting or challenging discharge decisions.
Discussion
This simple objective admission prediction tool with six variables can be used to accurately estimate the probability of admission at the point of triage. In comparison, other prediction tools, such as the King's Fund Combined Predictive Model, have required the institution of bespoke computer programmes, with associated costs in terms of software, skills and training.26 Other scores depend on information that would not be available until some time after presentation.9 ,27
Predicting admission at the time of triage could have several uses. The most obvious is in simple binary prediction, to give an idea of the likely outcome of an attendance to the patient and to staff. In this role, the score appears to have much higher sensitivity, specificity and positive predictive value than has been shown with experienced clinical triaging staffs’ intuitive predictions.13–16 This is not a problem specific to triage; simple scores often outperform expert intuition when there are many (possibly irrelevant) correlated variables to consider, and when the intuition deals with the prediction of future events.28 Simple scores perform better in these situations because they consistently apply the same rules, ignore irrelevant details, and are derived from outcome data.
However, using probabilities of admission generated by the score rather than a binary outcome, could have wider and more subtle uses. For example, it would be possible to direct patients in real time to different work-streams, such as ‘fast-track admission’, ‘rapid discharge’ or ‘senior review’ with any desired degree of accuracy. Work streams of this type have been shown to reduce waiting times, admission rates and inappropriate discharges.7 ,9–12
It has been shown that senior review reduces total admission rates by 11.9%, medical admission rates by 21.2% and inappropriate discharges by 9.4%.11 There is an opportunity to optimise outcomes by targeting senior clinical review at those patients whose admission/discharge decision is most difficult, and these are likely to be patients with intermediate scores.
Since the score is based on historical admission and discharge decisions the score could also act as a ‘sense check’ for junior staff, telling them how patients with similar presentations are typically dealt with by their peers. The value of the score in decision support should not be underestimated, because it predicts who is likely to be admitted, and also how likely it is that a patient will reattend and require hospital admission in the following 28 days if discharged. If the clinical decision is contrary to the norm for a particular score, this could generate a senior review. The score may, therefore, have some use in avoiding unnecessary admissions and reducing the likelihood of failed discharges.
A reliable predictor of admission could have uses other than the direct improvement in efficiency. Communicating the likely outcome to patients and their relatives at an early stage could increase patient satisfaction.29 Furthermore, if all the patients in a department who had not yet been seen by medical staff had an estimated probability of admission made in triage, then bed managers and receiving ward staff could use this information to aid planning of patient movement, bed allocations, staff allocation and catering. This could, in turn, improve resource allocation and reduce waiting times.30
Outside of ‘real-time’ clinical use, an admission prediction score could be used as a method of controlling for demographics, illness severity, past history, transport considerations and referral source when measuring the propensity of different units (or a single unit over time) to admit or discharge patients, allowing fairer comparisons and controlled evaluations of service innovations.31 ,32
The main limitation to this study was that although it used data from different units, the hospitals were all in the same geographic region. They will therefore share similar working practices, data recording methods, tertiary referral services and patient demographics. As this was an observational study, it is possible that there are unmeasured systematic biases that are particular to the region, and there is, therefore, no guarantee that the score's accuracy will hold elsewhere. However, there is no prior reason to think that local practices or facilities differ substantially from elsewhere in the UK, and demographic effects are largely incorporated in the score itself. It is therefore reasonable to assume that the score would be broadly applicable, at least within the UK. Another limitation is that although the NEWS and the Manchester triage system are widely used in the UK, their inclusion would limit the score's use internationally.
In conclusion, this simple score accurately predicts the probability of admission and reattendance, and has the potential to improve patient flow and efficiency in EDs and assessment units, while also facilitating analysis of trends in admissions within and between units. Further work is needed to show that it significantly outperforms triage nurses’ predictions in a direct comparison, and to demonstrate the extent to which incorporation of the tool into clinical practice actually improves care or use of resources.
References
Footnotes
-
Contributors All authors contributed to the design of the study. AC and KR prepared the original draft of the paper revised by GAM and approved by AI and RJ. GAM is the guarantor.
-
Competing interests None.
-
Ethics approval The advice of the West of Scotland Research Ethics committee was sought and the Chairman advised that this was an evaluation of anonymised routine clinical data, and formal ethics review was not necessary. Approval was also given by the local Caldicott guardian.
-
Provenance and peer review Not commissioned; externally peer reviewed.