Article Text

Abstract
Objectives This study aimed to assess the pattern of use of EDs, factors contributing to the visits, geographical distribution and outcomes in people aged 65 years or older to a large hospital in Dublin.
Methods A retrospective analysis of 2 years of data from an urban university teaching hospital ED in the southern part of Dublin was reviewed for the period 2014–2015 (n=103 022) to capture the records of attenders. All ED presentations by individuals 65 years and older were extracted for analysis. Address-matched records were analysed using QGIS, a geographic information systems (GIS) analysis and visualisation tool to determine straight-line distances travelled to the ED by age.
Results Of the 49 538 non-duplicate presentations in the main database, 49.9% of the total are women and 49.1% are men. A subset comprised of 40 801 had address-matched records. When mapped, the data showed a distinct clustering of addresses around the hospital site but this clustering shows different patterns based on age cohort. Average distances travelled to ED are shorter for people 65 and older compared with younger patients. Average distances travelled for those aged 65–74 was 21 km (n=4177 presentations); for the age group 75–84, 18 km (n=2518 presentations) and 13 km for those aged 85 and older (n=2104 presentations). This is validated by statistical tests on the clustered data. Self-referral rates of about 60% were recorded for each age group, although this varied slightly, not significantly, with age.
Conclusions Health planning at a regional level should account for the significant number of older patients attending EDs. The use of GIS for health planning in particular can assist hospitals to improve their understanding of the origin of the cohort of older ED patients.
- acute care
- aged
- emergency department management
- emergency department
This is an open access article distributed in accordance with the Creative Commons Attribution Non Commercial (CC BY-NC 4.0) license, which permits others to distribute, remix, adapt, build upon this work non-commercially, and license their derivative works on different terms, provided the original work is properly cited, appropriate credit is given, any changes made indicated, and the use is non-commercial. See: http://creativecommons.org/licenses/by-nc/4.0/.
Statistics from Altmetric.com
Key messages
What is already known on this subject?
The main point of entry to the acute healthcare system in Ireland is the ED and there is little variation in this among different age cohorts. Geographic information systems (GIS), while common in other research, are rarely used in aiding health planners and physicians for ED services, particularly when analysing older age cohorts.
What this study adds?
Using GIS, we found a high level of clustering of ED presentations in the Dublin area and the wider region, with some difference in spatial patterns based on age. Older patients are travelling shorter distances, on average, based on an analysis of mean straight-line distances. This suggests that the ability of the older population to reach medical care must be considered in planning configuration of services.
Introduction
Ireland’s recent census data show that the population over 65 years increased by 19.1% in 2016 since the previous 2011 census.1 Life expectancy continues to increase above the EU average for both men (79.6 years) and women (83.4 years), illustrating the ongoing socioeconomic advances and benefits of extended healthcare provision.2–4 A majority of older people (75%) in Ireland self-reported that they rate their health as good, very good or excellent, and are actively involved with their local communities and families.5 This increase in the older population has raised concerns as to whether the health service will be able to cope with the projected increased demand with attention focused on identifying the best pathway for treating older patients.6 7
In other national contexts, there are primary healthcare settings other than a hospital’s ED where older people receive the medical care they need; this is not the case in Ireland.8 In Ireland, the ED is the ‘front door’ of admission to the acute hospital and patients over 65 years account for a growing proportion of ED attendance.8 9 To enable better and appropriate health planning, we sought to understand more about the referral patterns and locations from which older patients attend EDs.
In trying to understand the patterns for the origins of ED patients, older persons’ access to EDs is important and within this, their own mobility is central.10–12 Mobility is the ability and opportunity to physically move oneself, either independently or with assistive devices or transportation, to get to places one wants or needs to go to.13 One way to analyse this is by using geographic information systems (GIS) which provide a set of tools to interpret and visualise geographical data to reveal relationships and trends.14 Spatially referencing data allow one to pose and answer questions and identify potential solutions to problems. Social scientists, epidemiologists and clinicians have been using GIS for a long time to understand the distribution and causes of illness, and the use of resources across countries and regions.15 16 Researchers using GIS frequently employ thematic maps which use statistics associated with a particular geographical area and show how these are related to other services and data.17 This type of mapping may be useful for planning of health services in a region and allows for analysis that takes into account the distance from the ED and other factors.16
The objective of this study was to demonstrate how GIS can be used to map the origin of patients presenting to a busy adult ED of the Dublin region. We sought to demonstrate if there is a difference in the median distances travelled based on age groups, if there are any differences in the geographical pattern of attendances of the older and younger patients.
Methods
Setting
This retrospective study examines the presentations to the ED of St. Vincent’s University Hospital (SVUH) a level 4 teaching hospital in the south Dublin area. The department provides Emergency Medicine to a catchment population of 300 000 people from inner Dublin City to north Wexford, about 60 km south. It is bordered by the sea to the east and the functional catchment area extends west for 6 km and further south again. SVUH is one of six-level four urban acute teaching hospitals located in county Dublin. These are the Mater Hospital, Beaumont Hospital on the northside of the city, St. James’s Hospital in the west of the city centre, Tallaght Hospital in the south west, James Connolly Memorial Hospital in the western suburbs. SVUH is presently part of the Ireland East Hospital Group (IEHG) comprising 11 hospitals spanning eight counties which serves a population of 1.1 million.
Participants and procedures
All ED presentations in the two calendar years of 2014 and 2015 and from all age groups were eligible for inclusion. Data were derived from the clinical and administrative records from each patient presentation. Each patient is assigned a medical record number (MRN), which they retain throughout their time interacting with SVUH. For patients who presented on more than one occasion during the study period, just one presentation was included in the analysis. Using OpenRefine (a data cleaner and parser), the duplicate MRN presentations were identified and discarded. The home address for each patient is recorded at ED, including those coming from locations other than home. These were extracted as address fields and machine-read as latitude and longitude data.
Only non-duplicate presentations for calendar years 2014 and 2015 and a second and smaller address-matched database are included in this study. Figure 1 shows the representation of the workflow to derive a database that was suitable for spatial analysis. The address-matched records were analysed using QGIS, a commonly used GIS application that allows for the ingestion, analysis and visualisation of spatially referenced data. In this way, we are able to analyse our data alongside socioeconomic data from other sources to examine the factors associated with self-referral among the older age population.

The data workflow. MRN, medical record number.
From this address-matched subset, we extracted all patient records aged 65 years and older (figure 1). Wishing to understand any age-based differences, the subset was further subdivided into three smaller groups: 65–74, 75–84, and 85 and older. These correspond with the older age categories used by the Central Statistics Office, Ireland. Once the main and address-matched databases are created, no name or address details are retained to protect the anonymity of the patient. All patient data were stored on a removable drive and stored securely. Records with an address-matched MRN were compared with those without and it was found that no significant statistical difference could be detected between these two groups with regard to age and other demographic variables.
No name or address details were retained to protect the anonymity of the patient.
Analysis
For the basic analysis of these data, we used SPSS Statistics V.24. The dataset was grouped by year for comparative purposes at the initial stage. As the address-matching process joined data between two tables where a match occurred, the address-matched data thus had all other ED presentation data aligned within each record such that the demographic, triage and admission data could be analysed spatially. No individual point data are represented throughout this analysis but instead we generalise the deidentified data using a derived 10 km grid square (provided by the national statistical agency, the Central Statistics Office). These are a uniform aerial unit to visualise the spatial differences in the deidentified presentations on a consistent basis for each age cohort. All points that fall within this grid square are considered within that area. These data can be then graduated in different modes within QGIS. Our analysis here is based on Jenks natural breaks to minimise variability between and within the gradations of data. Only those grid squares with totals equal to or greater than 10 are represented to further safeguard patient anonymity. Accompanying Voronoi diagrams are based on all spatially referenced data and show banded metric distances from SVUH. To add to our analysis, we measured the spatial autocorrelation of the data, used a nearest neighbour analysis (to examine the distribution of points) and Moran’s I as a means of detecting any patterns. When points are dispersed, this score tends to −1 and some clustering when it tends to +1. This statistical test is presented for each over 65 years subgroup.
Outcomes
We determined the proportion of patients in each age group attending the ED, their acuities and the location of the incident that brought them to the ED. We determined whether patients were self-referred or referred by a physician; patients who are referred in this context means that if a patient enters the ED having already seen a general practitioner (GP), they would have had a referral letter and a consequent reduction in the charge levied in the ED. The differences in straight-line distance of each patient from the ED was examined, and the mean distance was calculated for the three different age cohorts.
The differences in straight-line distance of each patient from the ED for each of these smaller groups were examined.
Results
There were 103 022 recorded presentations in all age groups during the study period. Once duplicate MRNs were discarded, we were left with 49 538 records. Of these 49 538 records, 49.9% of the total are women and 49.1% were men (a tiny fraction went unrecorded); this mirrors the gender breakdown for Irish society as a whole.1 While this paper is concerned with older age groups, we sought to highlight the differences between the study group and the total population served by the hospital and so have included these data. Of the 49 538 non-duplicate presentations, 75.7% are aged 64 years or younger with 10.2% aged between 65 and 74, 8.6% aged between 75 and 84, and 5.4% aged 85 years and older (table 1). Table 2 shows the triage category data for each age category, with approximately two-thirds of each year’s presentations designated as urgent or very urgent.
Recoded age cohorts by percentage for 2014 and 2015; percentages and numbers are of the total presentations for each year
Triage categories by percentage for ED presentations for 2014 and 2015; percentages and numbers are of the total presentations for each year
Triage category is decided on arrival to the ED. Approximately one-fifth (21.2%) of those aged 64 and younger were considered in the very urgent category, whereas over one-third (34.9%) of those aged 85 and older were very urgent or immediate (table 3). Of note, however, at this point is the slight divergence in proportions for the urgent category across all four age groups. These data are examined by year to show consistency across the 2 years of the data. For all cross-tabulated data, the χ2 score is 0.00.
Percentage of each age group by triage category; percentages and numbers are of the total in each age group by triage category, that is, column-based N in parentheses
Most patients in all age groups were self-referred. Between one-fifth and one-quarter (11 176) of all patients who presented each year were referred by their GP and a further 10% each year by another doctor or a doctor on call in the area. As shown in table 4, there was a slightly smaller proportion of self-referrals and more GP referrals among patients aged 65–84, those in the oldest age cohort had a higher proportion of referrals through other sources.
Selected referral routes by age cohort for 2014 and 2015; percentages and numbers are of the total in each referral route by year, that is, column-based N in parentheses
Between 75% and 90% of the presentations in both years come from either home or a public place (table 5). The remainder are from work or a leisure area. Over 60% of incidents occurred at home for all age groups, but with a larger proportion of events at home for those over 65. The difference in events occurring in the home location is most marked between those 64 and younger compared with the older cohorts, and for nursing homes, between those aged greater than 85.
Location of incident by age cohort for 2014 and 2015; percentages and numbers are of the total in each location by year, that is, column-based N in parentheses
Age-based spatial analysis using GIS
In this section, we see if there are any spatial differences between the different age groups and their distance from ED. As previously mentioned, among those 65 and older, we have divided the address-matched data into three subgroups: those aged between 65 and 74, totalling 4212 presentations; those aged between 75 and 84, totalling 3539 presentations; and those aged 85 and over, totalling 2129 presentations for the 2-year period. We mapped the distance to St. Vincent’s University ED for each age cohort. While the colour gradations are chosen to aid visual interpretation, they indicate a banding of the data into discrete categories. Care should be taken here in the interpretation of the colour shading as the category gradations differ across the age groups. For example, the largest group in the younger age cohort ranged between 862 and 1008 people (figure 2), while in the oldest age cohort, the largest numbers ranged between 463 and 665 people (figure 3). Each grid square represents a straight-line distance of 10 km, we can note intracohort differences.
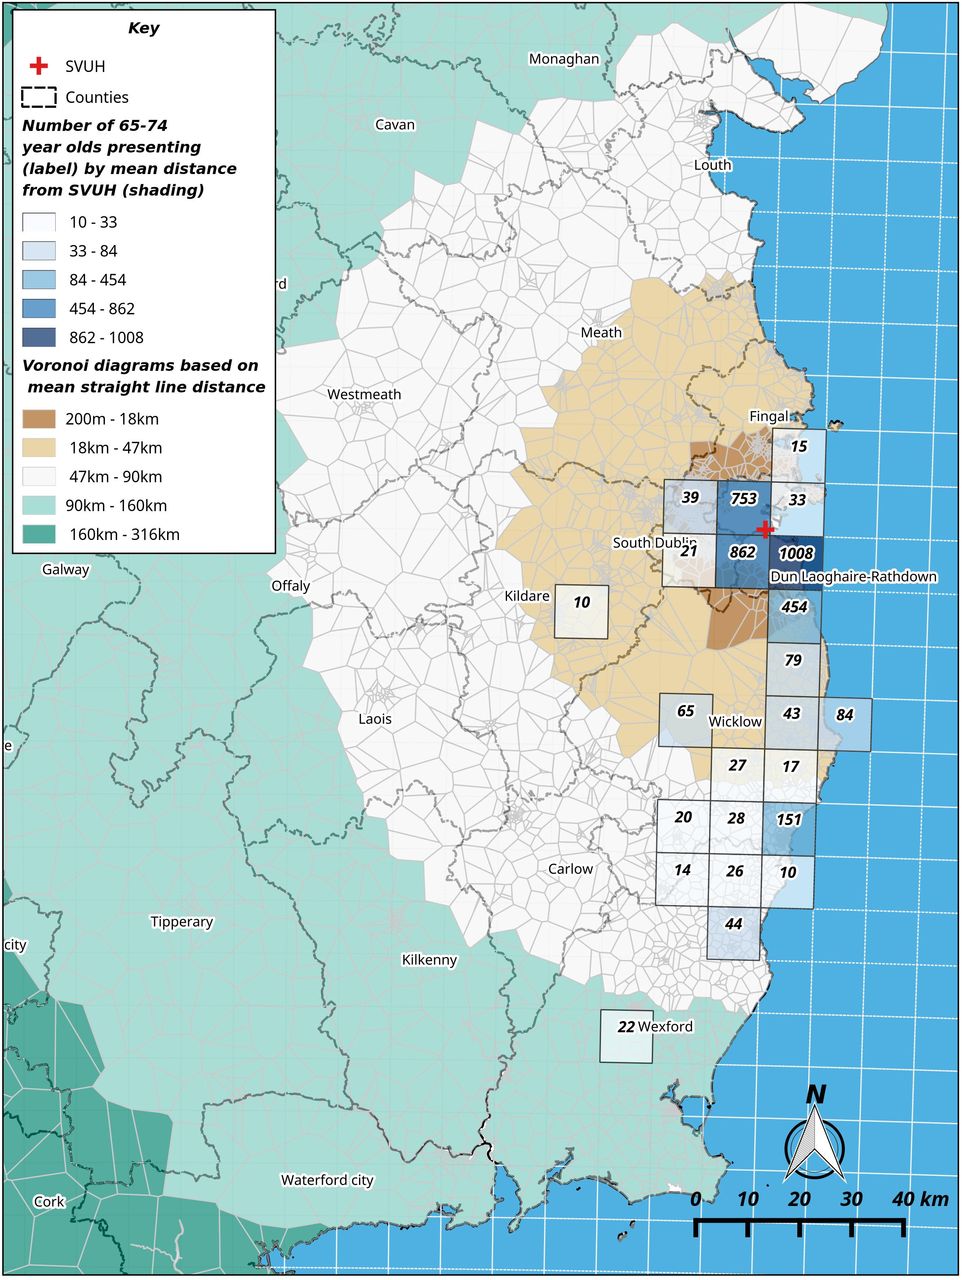
The number of ED presentations in the cohort aged 65–74 years old and all presentation distance from St. Vincent’s University Hospital (SVUH).
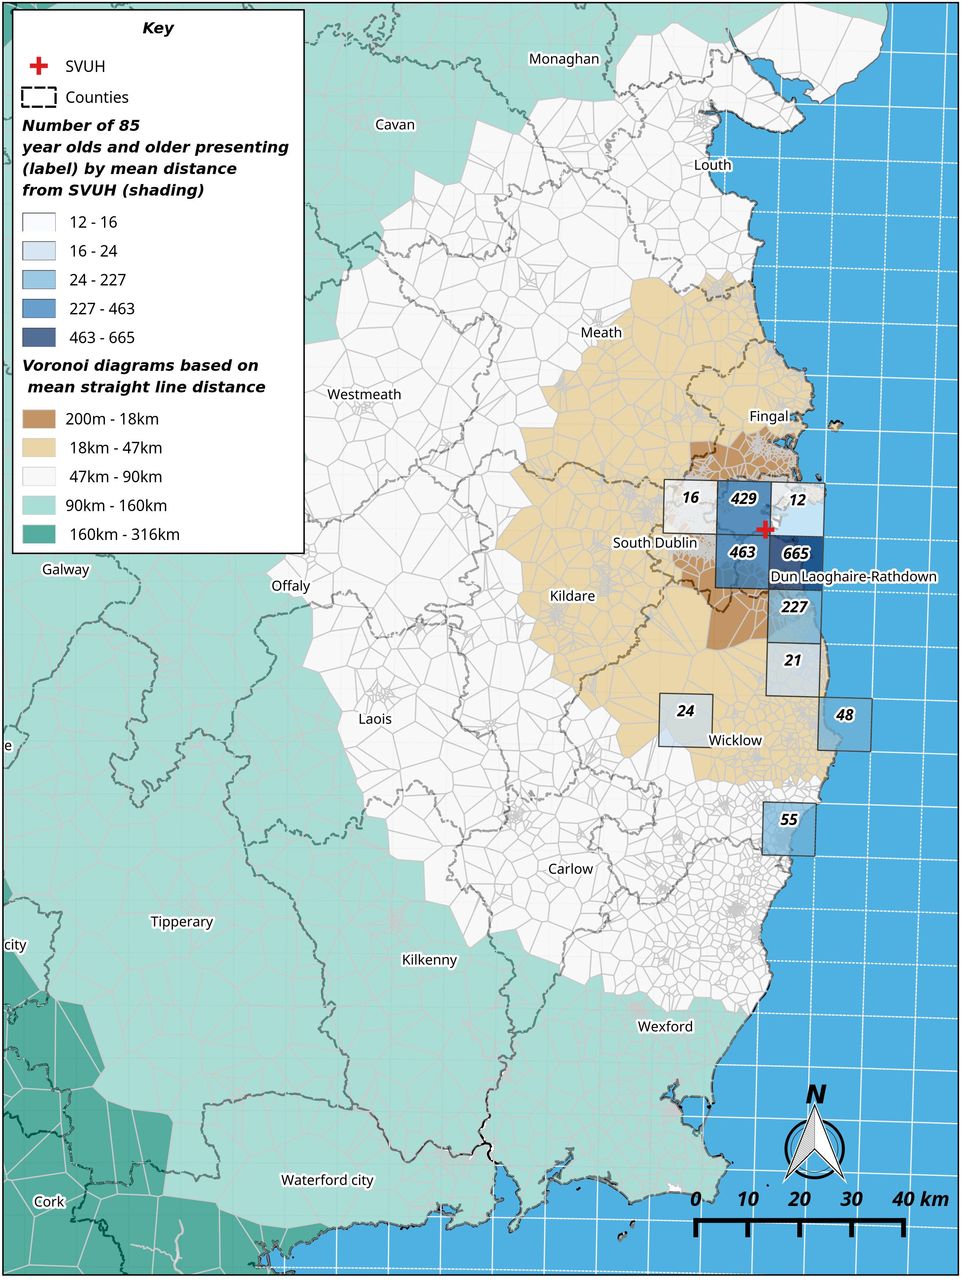
The number of ED presentations in the cohort aged 85 years and older and all presentation distance from St. Vincent’s University Hospital (SVUH).
As shown in figure 2, for the 65–74 age cohort, large numbers of patients come from within a distance of 10 km from the hospital, in particular the neighbourhoods directly south of the site. The hospital also draws patients in this age cohort from home addresses in the city centre in spite of other EDs being available within the city area, for example, St. James’s and the Mater hospitals. Patients with home addresses in mid-Wicklow and south-Wicklow (approximately 45 km from SVUH) are also numerous, as indicated by the third gradation of blue in the map above. Small numbers of people in this age cohort come from addresses in south County Wicklow to the south and small numbers from mid-Kildare in the southwest.
For the 75–84 age cohort, the numbers with addresses from directly south of the hospital are still large but numbers also begin at addresses further south and from the more mountainous part of County Wicklow, despite the lack of public transport options. As figure 4 shows, these mid-Wicklow patients are approximately 45 km from SVUH. More notable is the almost complete absence of people in this age cohort from home addresses of a similar straight-line distance in County Kildare. This may be accounted for by the availability of other EDs (for which we have no data) in that county.

The number of ED presentations in the cohort aged 75–84 years old and all presentation distance from St. Vincent’s University Hospital (SVUH).
Finally, for those aged 85 and older, we can see a slightly different pattern of patient origins. Figure 3 shows that many hundreds are coming from the immediate area (within 10 km) but about 50 patients each are coming from addresses in the towns of Arklow and Wicklow to the ED in south Dublin (a distance between 45 and 50 km).
The statistical evidence shows that there is a high degree of clustering for each of the age cohorts’ addresses. This means that patients in each age cohort originate from addresses close to each other and travel similar distances to those in their own cohort. There is little change in the Moran’s I score for any group when compared. The mean straight-line distance travelled declines with age and among those aged 85 and older, the distance travelled is averaged at 13 km. This is 7.8 km fewer than those aged between 65 and 74. As suggested in the fourth column, table 6, even for older age groups, supports in the community are by-passed and these people present to the ED regardless of their distance from it.
Summary of distance and clustering data for the three oldest age cohorts for the spatially referenced data
Z scores for these data are high (45.7, 44.5 and 43.9, respectively), suggesting that we can reject the null hypothesis that there is no clustering; the p-values are statistically significant. The Moran’s I scores suggest that there is a relatively high level of spatial autocorrelation in these data.
Discussion
The use of GIS in investigating the relative importance of geographical factors on utilisation patterns has been previously advocated.18–21 This single hospital study outlines the methodology to establish geographical factors on utilisation patterns across the IEHG consisting of 11 hospitals and serving over 1 million people. We found a high level of clustering of patient home addresses in the Dublin area and the wider region, with some difference in spatial patterns based on age. In particular, older patients travel shorter distances on average, based on mean straight-line distance from their home address. In the absence of the location data for other primary healthcare facilities, distance from a home address to the ED does not seem to be of great significance for the 65–74 year old cohort when compared with the cohorts of 75 years and older.
Although not examined here in detail, self-referral is high among all age cohorts, ranging between 59% and 65% of all ED presentations. There is a need for further mapping of these self-referrals to the location of GP practices and their interaction with nearby EDs. Furthermore, work on the modes of transportation among the self-referred cohorts (eg, those who perhaps by-passed a GP en route to hospital) is needed to understand mobility patterns among older patients and how this can contribute to the planning of health resources. For older age groups, distance travelled to the ED is lower but greater numbers come from nursing home settings.
Our study has several limitations. The analysis presented does not take into account the mode of travel for these ED presentations. Nor have we factored in the distance from other primary healthcare facilities. Furthermore, we have only analysed the mean straight-line distance from the point of the hospital site. Road and other transport networks are not a factor in the measurement of the distance travelled from their address by each age cohort. It would be interesting to understand any differences in distance travelled based on other hospital catchment areas, but this is beyond the scope of the current study. We have also been able to spatially identify a proportion of the total number of presentations because of the MRN-matching record process. The difference between MRN-matched and non-MRN-matched data with regard to demographic and age-related data does not show great statistical differences but we would like to explore the ways in which a greater proportion of ED presentations can be spatially referenced in the manner outlined above. We feel that such a comparative analysis across the region would yield significant results in how health resources across that region could be planned for and allocated.
An implication of our study is that health planning and any service reconfiguration at a regional level must take account of the significant number of older patients attending an ED before their GP. Through the use of a spatial analysis and in particular the analysis here of mean straight-line distances for individual patients suggests that older patients travel shorter distances and in smaller numbers than their younger neighbours. Our work gives some insight into how changes to healthcare provision in an area like this could be impacted. We may have to further examine the ways in which distance influences age-based utilisation and interactions in a network of hospitals and non-hospital primary health services. Further work on self-referral cases is now being conducted on these data. We believe that this form of geospatial analysis would be central to this.
Acknowledgments
The research team acknowledges the inputs shared on the data by the St. Vincent’s University Hospital ED staff.
Footnotes
Correction notice Since this article was first published online, affiliation 1 has been updated to read the School of Geography.
Contributors All the authors have made significant intellectual or practical contributions towards the development of the geographic information systems review. EO’M and ÉNS drafted the manuscript and all authors read, edited and approved the final manuscript.
Funding Supported by grant from the Health Research Board for the Systematic Approach for Improving care for Frail Older People (SAFE) study under the Applied Partnership Award Grant No. (APA-2016–1857).
Competing interests None declared.
Patient consent for publication Not required.
Ethics approval Ethical approval to conduct the study was provided by St. Vincent’s Healthcare Ethics and Research Committee on 15 February 2017 (Ref SAFE: 23/2/17).
Provenance and peer review Not commissioned; externally peer reviewed.
Data availability statement No data are available.