Article Text

Abstract
Introduction The urgent and emergency care (UEC) system is struggling with increased demand, some of which is clinically unnecessary. Patients suffering suspected seizures commonly present to EDs, but most seizures are self-limiting and have low risk of short-term adverse outcomes. We aimed to investigate the flow of suspected seizure patients through the UEC system using data linkage to facilitate the development of new models of care.
Methods We used a two-stage process of deterministic linking to perform a cross-sectional analysis of data from adults in a large region in England (population 5.4 million) during 2014. The core dataset comprised a total of 739 436 ambulance emergency incidents, 1 033 778 ED attendances and 362 358 admissions.
Results A high proportion of cases were successfully linked (86.9% ED-inpatient, 77.7% ED-ambulance). Suspected seizures represented 2.8% of all ambulance service incidents. 61.7% of these incidents led to dispatch of a rapid-response ambulance (8 min) and 72.1% were conveyed to hospital. 37 patients died before being conveyed to hospital and 24 died in the ED (total 61; 0.3%). The inpatient death rate was 0.4%. Suspected seizures represented 0.71% of ED attendances, 89.8% of these arrived by emergency ambulance, 45.4% were admitted and 44.5% of these admissions lasted under 48 hours.
Conclusions This study confirms previously published data from smaller unlinked datasets, validating the linkage method, and provides new data for suspected seizures. There are significant barriers to realising the full potential of data linkage. Collaborative action is needed to create facilitative governance frameworks and improve data quality and analytical capacity.
- research, methods
- prehospital
- neurology, epilepsy
- EDs
- emergency care systems
This is an open access article distributed in accordance with the Creative Commons Attribution Non Commercial (CC BY-NC 4.0) license, which permits others to distribute, remix, adapt, build upon this work non-commercially, and license their derivative works on different terms, provided the original work is properly cited, appropriate credit is given, any changes made indicated, and the use is non-commercial. See: http://creativecommons.org/licenses/by-nc/4.0/.
Statistics from Altmetric.com
Key messages
What is already known on the subject
The UEC system is struggling with increased demand some of which is clinically unnecessary and potentially avoidable.
Lack of good-quality data on patient flow through the UEC system is a barrier to developing interventions to improve care and to reduce unnecessary attendance/admissions for conditions such as seizures.
Suspected seizures are the most common neurological cause for emergency ambulance calls and admissions to hospital, but these patients are thought to be at low risk for adverse outcomes.
What this study adds
Data linkage within the UEC system is possible and can provide powerful insights into system performance which unlinked data cannot, but there are significant barriers to realising its full potential.
Suspected seizures represented 2.8% of all ambulance service incidents, 61.7% of these incidents received a rapid-response ambulance, 72.1% were conveyed to hospital and 0.3% died prehospital or in ED. The inpatient death rate was 0.4%.
Suspected seizures represented 0.71% of ED attendances, 89.8% of these arrived by emergency ambulance, 45.4% were admitted and 44.5% of these admissions lasted under 48 hours.
Introduction
Urgent and emergency care
Urgent and emergency care (UEC) services provide substantial health benefits, but increasing demand is leading to unsustainable pressure and the need for increased funding or new models of care. In the NHS in England (one of the devolved nations of the UK) in 2013–2014, there were 21.8 million attendances at major EDs, single-specialty EDs, walk-in centres and minor injury units at a cost of £2.7 billion.1 These figures have increased year-on-year, with 24.8 million attendances in 2018–2019,2 putting huge demands on staff which may in turn be associated with avoidable mortality.3 4 These issues make innovations in the effective delivery of UEC a priority for policy-makers and the public.
Inadequate linking of data between organisations
The development of new models of care such as alternative care pathways to reduce avoidable attendances/admissions is hindered by a lack of data and a lack of analytical capabilities to provide a detailed picture of the UEC system in terms of patient characteristics and patient flow. Individual provider data exist, such as ambulance services and EDs, but there have been no large-scale attempts to link this data across different providers to show patient flow through the whole UEC system. Large-scale data linkage would facilitate an understanding of how the system is used from the point of contact (such as an emergency 999 call) through different parts of the system (into the ED and onto hospital wards). For example, how do patients access the UEC system (via 999 ambulance, A&E, direct inpatient admission), what is the mode of transport of patients to ED (ambulance or self-transport), is the ambulance response time appropriate, what is the best method of case ascertainment (ambulance Advanced Medical Priority Dispatch System [AMPDS] codes, ED diagnosis codes) and what are the outcomes of patients who are transported to hospital by ambulance (admission/discharge, length of stay, death)? Understanding the whole system is an essential step toward developing appropriate patient-focused interventions that can lead to a sustainable, safe and cost-effective new models of care.
Suspected seizures
Suspected seizures are an excellent exemplar for the development of new models of care in the UEC system and they are a topic of interest in their own right. Suspected seizures give rise to 60 000 ED attendances per year (estimated 2%–3% of all attendances),5 they are the most common neurological cause for admission to hospital in England6 and international data shows a similar pattern.7 8 However, most seizures are self-limiting and do not require emergency medical treatment and therefore much UEC activity for these patients is potentially avoidable.5 9 10 Nevertheless, previous interventions in this area have failed to demonstrate significant improvements and important questions remain to be answered, such as: what is the best level to target the intervention (ambulance, ED, inpatient), how can high-risk cases be differentiated from the majority of low-risk cases and are there alternative places of care for patients who need simple investigations but do not require the full facilities of an ED? Developing a detailed picture of these patients and their flow through the UEC will allow the development of targeted interventions in the future.
Aims
We aimed to investigate the flow of patients with suspected seizures through the UEC system using a data linkage method to generate data which could contribute to the development of new models of care. We also aimed to assess feasibility of the linkage method for future studies and to comment on issues, such as data quality, diagnostic coding systems and data governance.
Methods
Design and setting
As part of the Collaboration for Leadership in Applied Research and Care Yorkshire and Humber (Y&H), we undertook a retrospective cross-sectional analysis which involved linking routine NHS health data from a number of UEC providers within a single geographical region in England (Y&H). The region has a population of 5.4 million people with a mixture of urban (large and small), suburban and rural settings and as such is representative of the UK. At the time of data collection, the region included 13 acute hospital trusts with 19 type 1 EDs (consultant-led, has multispecialty 24-hour services with full resuscitation facilities). The Y&H region is served by a single ambulance service (Yorkshire Ambulance Service, YAS).
Data collection
The data covered all adults (aged >16 years) for the period 1 January 2014 to 31 December 2014. Ambulance service data were taken from the computer-aided dispatch system comprising all data recorded during the emergency call(s): patient identifiers (name, date of birth, address, postcode and NHS number), all times related to the call, AMPDS triage priority category (with attendant complaint description) and outcome (such as transport to hospital).
Hospital data were extracted by the acute trusts from their ED and inpatient administration systems. ED data included age, sex, date of attendance, attendance category (first or follow-up attendance), arrival mode (ambulance or other), attendance disposal (including whether discharged, admitted or referred for follow-up), clinical investigations, clinical treatments and diagnosis. Inpatient data comprised date of admission, method of admission, source of admission, date of discharge, discharge destination and diagnosis.
Details of all variables collected in the data are listed in online supplementary appendix 1.
Supplemental material
Data management and data linkage methodology
Data quality checks were undertaken to identify missing and incongruent values, followed by standardisation of inconsistent variable coding systems across the ED and inpatient datasets. Where possible, re-coding of variables was undertaken to simplify the analysis (primarily collapsing the original coding into more clinically meaningful categories). Decisions on the re-coding of variables were undertaken by the research team which included ED consultants and data management specialists.
After completion of data quality checks and standardisation of the hospital datasets, a two-stage process of deterministic linkage of ED data, inpatient data and ambulance service data was undertaken to create the core dataset. This methodology was based on work by Downing et al 11 and the process is summarised in figure 1 (full details of the linking process are included in online supplementary appendix 2). In the first stage, each ED attendance which led to a hospital admission was linked ‘forwards’ to the corresponding inpatient episode. In the second stage, each ED attendance where the patient arrived by emergency ambulance was linked ‘backwards’ to the corresponding ambulance service incident. Following completion of this linkage process, all recorded YAS incidents for 2014 were added to the dataset (to ensure that ambulance service incidents which did not lead to transport to ED were included in the core dataset). Duplicate data corresponding to ambulance service episodes already identified through the linkage process was then removed, leaving a core dataset containing all YAS ambulance incidents, all ED episodes and any linked inpatient episodes for 2014. The core dataset was used for all subsequent analyses.
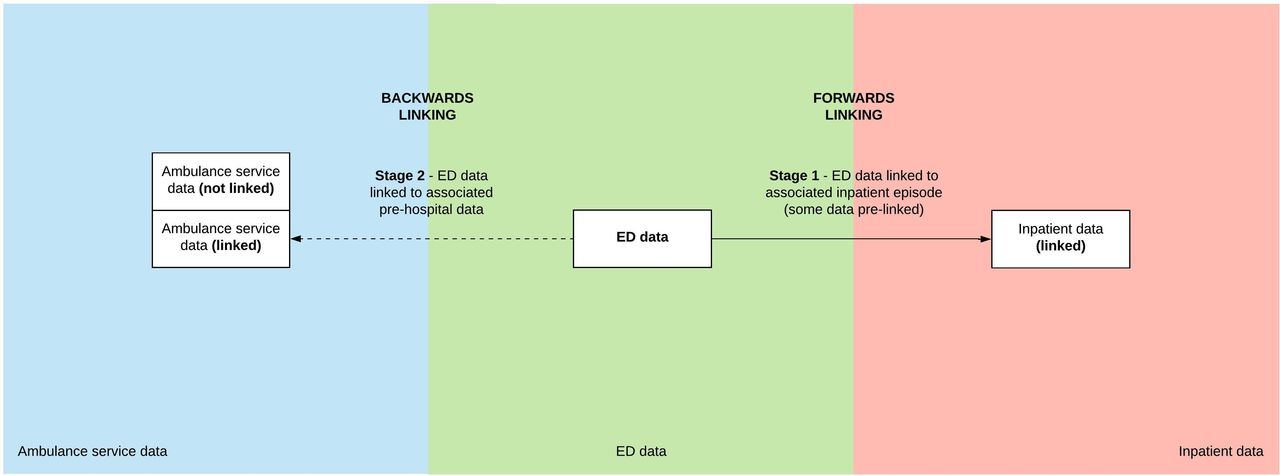
Construction of the core dataset.
Case ascertainment for suspected seizures
Using the core dataset, we identified patients with suspected seizures in two ways: (1) from ambulance service data and (2) from ED data. We identified suspected seizures in the ambulance service data using the AMPDS code 12 (convulsions/fitting). AMPDS 12 has been shown to have good specificity for seizures in previous studies.9 10 We identified ED attendances for suspected seizures by searching the diagnosis field for text containing ‘epile’, ‘seiz’, ‘fit’ or ‘convulsion’. ED diagnoses containing one or more of these text strings were reviewed independently by JMD and TH-G and a consensus agreed on which patients to include in the analysis (diagnoses with less than five incidents were not included). The list of included diagnostic terms as found within the core dataset is presented in online supplementary appendix 3.
Analysis and missing data
All analyses were carried out using SPSS 22.0 (IBM). The number of incidents with missing data for each variable is reported in the results. A reattendance at the ED was defined as an ED incident with a variable indicating a previous ED attendance for ‘suspected seizure’ by the same patient within the study period.
Patient and public involvement and engagement
There was no patient involvement in the study design.
Results
The core dataset comprised a total of 739 436 ambulance service emergency incidents, 1 033 778 ED attendances and 362 358 inpatient attendances. Linking of data between ED attendances and inpatient episodes was achieved for 86.9% of ED admissions. Linking of data between ED attendances and ambulance service incidents was achieved in 77.7% cases.
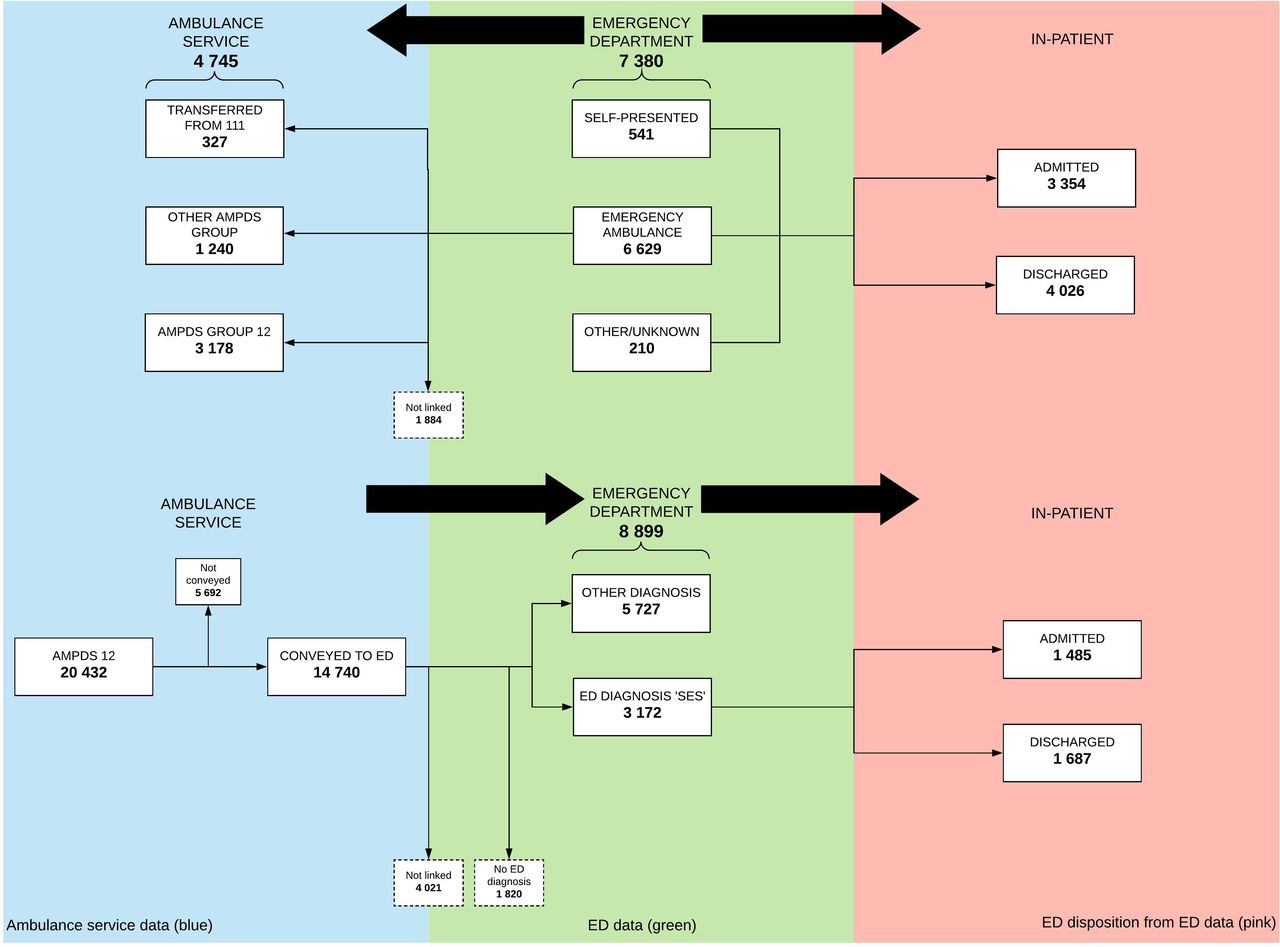
Figure 2A,B summarise the identification of patients and their flow.
Identification and flow of suspected seizures through the UEC system. (A) Shows identification using the ambulance service data and (B) identification using the ED data.
Seizures identified from ambulance service data
Of 739 436 ambulance service emergency incidents, 20 432 (2.8%) were AMPDS code 12 (convulsions/fitting). The majority of incidents led to dispatch of an ambulance with the most rapid response time (8 min) (61.7%, 12 613 incidents). 1931 incidents (9.5%) had a target response time of 20 min and 2397 (11.7%) a target of 30 min. 3491 incidents (17.1%) did not have an ambulance dispatched immediately and were referred for telephone assessment by a clinician. The majority of patients were conveyed to hospital (14 740/20 432; 72.1%); table 1 shows the outcome of all 20 432 ambulance incidents. Thirty-seven patients died before being conveyed to hospital and 24 died in the ED (61/20 432; 0.3%).
Outcome of AMPDS code 12 999 calls
Seizures identified from ED data
Of 1 033 778 ED attendances, 7380 (0.71%) were suspected seizures. Of the 7380 suspected seizures, 6629 (89.8%) were recorded in ED data as having arrived by emergency ambulance. Of these, 4745 (71.6%) were successfully linked to an ambulance service incident. Table 2 shows the AMPDS code assigned to ED incidents. Table 3 shows the investigations and treatments undertaken in the ED.
AMPDS codes recorded in prehospital data for ED attendees
Clinical investigations and treatments performed on ED attendees
3411 attendances (46.2%) were by patients who had already attended the ED within the calendar year. 650 (8.8%) re-attended within 7 days and the median time for re-attendance was 25 days (IQR 10–83 days). After attending the ED, 4026 patients (54.6%) were discharged (1536 without follow-up), 56 patients did not have an ED disposition recorded and 3354 patients (45.4%) were admitted (according to ED data). No patients with an ED diagnosis of suspected seizure died in the ED (although, as above, 24 patients arrived in the ED via AMPDS code 12 and died before receiving an ED diagnosis). Of 3354 admitted patients, 2985 were successfully linked to an inpatient record (89.0%). Of all the admitted patients, 1491 (44.5%) had data to show they remained as an inpatient for less than 48 hours. Of these, 486 (14.5%) remained as an inpatient for less than 24 hours. There were no data on length of stay for 203 patients with a linked record. 33/7380 (0.4%) patients died while an inpatient.
Discussion
Data linkage
Overall, linkage rates were high (86.9% ambulance ED and 77.7% ED inpatient). The completed dataset presented individualised linked patient data for a wide set of variables (online supplementary appendix 1) across each patient journey. This allowed us to track flow and perform data analysis at any point from a 999 call to discharge from hospital, with the aim to facilitate a detailed understanding of patient characteristics in our exemplar population of seizure patients.
However, the process of data linkage was labour intensive, time consuming and ultimately imperfect. The absence of a universal unique patient identifier in the source data is what necessitated the hierarchical linking method that we used. The whole process, starting with the raw data and ending with release of the core dataset took many months, and a single step, for example, removal of duplicates, could take weeks. Although overall linkage rates were high, a comparison of the data in equivalent cells in figure 2A,B highlights discrepancies in the data arising from patient identification using the two different case ascertainment methods and with linkages made in different directions. If each organisation coded ‘suspected seizure’ in the same way, equivalent cells in figure 2A,B would vary only where true clinical differences existed.
Prehospital care and conveyance to hospital
Our data show that 2.8% of all ambulance service incidents are due to suspected seizures, the majority of incidents give rise to dispatch of an emergency ambulance with an 8 min response time and 72.1% were conveyed to hospital. These results are consistent with previous smaller studies9 12 and confirm that conveyance rates for suspected seizures are higher than the 63.0% average conveyance rate for all conditions across UK ambulance services.13
Previous studies have shown that a high proportion of AMPDS code 12 incidents are confirmed as suspected seizures by paramedics and hospital doctors9 10 14 but the proportion of suspected seizures given an alternative AMPDS code has never been assessed (ie, not code 12). Our study allowed us to explore this using ED diagnoses and then linking backwards to AMPDS codes. 43.1% of ED patients with suspected seizures had the AMPDS code 12, and the remainder had an alternative code or were not successfully linked to an ambulance record. This apparently poor concordance is likely to be due to failed linkages and poor-quality diagnostic data from ED.
ED coding, medical care and mode of arrival
89.8% of suspected seizure patients arrived in ED by emergency ambulance, this result is similar to the data from the National Audit of Seizure Management in Hospitals (NASH)5 and is much higher than the percentage for all conditions which is 23.9%.13 Our data confirm the high re-attendance rate for suspected seizures (46.2%) many of whom will have epilepsy (61% of patients presenting with a seizure to the ED have a diagnosis of epilepsy).5 Previous studies found that >60% of epilepsy patients re-attended the ED within 12 months,15 in contrast to 24% of patients using the ED generally.16 Re-attendance to the ED for patients with epilepsy is an indicator of suboptimal scheduled care.15
Death
Previous studies have shown the incidence of cardiac arrest among patients with suspected seizures identified using AMPDS 12 to be 0.0%–2.1%.9 17 18 Our data identified 94 deaths: 37 prehospital deaths, 24 ED deaths (both from 20 432 AMPDS 12 calls; total 0.3%) and 33 inpatient deaths (from 7380 ED attendances identified using ED diagnosis; 0.4%). It should be noted that identification using only AMPDS 12 regardless of ED diagnosis identifies a further 43 inpatient deaths. Deaths in the ED were identified using AMPDS 12 and looking for those with an ED disposition ‘died in department’. These patients had diagnoses such as ‘cardiac arrest’ rather than suspected seizure. No patients identified using ED diagnosis of suspected seizure were recorded as dying in the ED. Discrepancies arising from different methods of case ascertainment make it difficult to give a single figure for the overall death rate.
Limitations
Data quality was an important limitation in this study and this has important implications for practice and policy (see Implications for practice and policy section). AMPDS has previously been shown to perform well in identifying patients with suspected seizures, in contrast we have shown that ED diagnosis codes have poor fidelity, with no single term for seizures being consistently used across trusts (Hospital Episodes Statistics [HES] data dictionary codes, International Classification of Diseases codes and free-text recording were all used by different hospitals). In addition, poor quality investigation and treatment data (eg, only 39.1% patients documented as having vital signs recorded) was a barrier to assessing if individual ED attendances were avoidable.19 With 45.4% of patients in our study admitted to hospital, of which 44.5% were discharged within 48 hours (14.5% of these within 24 hours), it is possible that many patients could be categorised as an avoidable admission and that medication/education could potentially be optimised to reduce emergency attendances.15 However, our admission data was not granular enough to draw robust conclusions.
Implications for practice and policy
This study has shown that a two-stage deterministic linking process can effectively link episodes of care to demonstrate flow of patients through the UEC system. This linking gives powerful insights into the performance of the system and into potential interventions to improve performance, such as alternative care pathways designed to divert patients from unnecessary emergency care to scheduled specialised care. Our data support further work using data linkage methodology to identify patients and develop interventions for alternatives to UEC provision. However, linking methods have significant limitations and realising the full potential of linked data will require health and biomedical informatics partnerships (involving academics, funding bodies and industry), collaborations between the owners/guardians of the data, new software, new methods of analysis and data visualisation.20 21 This new capacity will need to be national and interdisciplinary, with support from policy-makers and government to create the digital environment in which data analysis can thrive and in which national standards on data collection and quality allow population level research with the NHS, and in which governance and permissions processes are proportionate and rapid.
References
Footnotes
Handling editor Caroline Leech
Twitter @Dr_J_M_Dickson, @ProfSueMason
Contributors JMD and SM conceived and planned the study, and both of them supervised TH-G. TH-G analysed the data and wrote the first draft of the Methods and Results. JMD wrote the initial draft of Introduction, Discussion and Abstract sections. CO redrafted Methods section and drafted the appendices. All authors contributed to and approved the final manuscript.
Funding This report is independent research funded by the National Institute for Health Research Y&H ARC. Funding reference: IS-CLA-0113-10020.
Disclaimer The views expressed in this publication are those of the author(s) and not necessarily those of the National Institute for Health Research or the Department of Health and Social Care.
Competing interests None declared.
Patient and public involvement Patients and/or the public were not involved in the design, conduct, reporting or dissemination plans of this research.
Patient consent for publication Not required.
Ethics approval Ethical approval for use of the dataset in this research was gained from the NHS Research Ethics Committee (REC reference 14/YH/1139). The NHS Health Research Authority Confidentiality Advisory Group also approved the research (CAG REC reference 14/CAG/1015).
Provenance and peer review Not commissioned; externally peer reviewed.
Data availability statement Deidentified, linked participant data forming the core dataset as used in the study available from first author (ORCID 0000-0001-8483-5686) upon reasonable request and with the agreement of other authors. No other data are available.