Article Text

Abstract
Background The large volume of patients, rapid staff turnover and high work pressure mean that the usability of all systems within the ED is important. The transition to electronic health records (EHRs) has brought many benefits to emergency care but imposes a significant burden on staff to enter data. Poor usability has a direct consequence and opportunity cost in staff time and resources that could otherwise be employed in patient care. This research measures the usability of EHR systems in UK EDs using a validated assessment tool.
Methods This was a survey completed by members and fellows of the Royal College of Emergency Medicine conducted during summer 2019. The primary outcome was the System Usability Scale Score, which ranges from 0 (worst) to 100 (best). Scores were compared with an internationally recognised measure of acceptable usability of 68. Results were analysed by EHR system, country, healthcare organisation and physician grade. Only EHR systems with at least 20 responses were analysed.
Results There were 1663 responses from a total population of 8794 (19%) representing 192 healthcare organisations (mainly UK NHS), and 25 EHR systems. Fifteen EHR systems had at least 20 responses and were included in the analysis. No EHR system achieved a median usability score that met the industry standard of acceptable usability.
The median usability score was 53 (IQR 35–68). Individual EHR systems’ scores ranged from 35 (IQR 26–53) to 65 (IQR 44–80).
Conclusion In this survey, no UK ED EHR system met the internationally validated standard of acceptable usability for information technology.
- communications
- comparative system research
- data management
- efficiency
This is an open access article distributed in accordance with the Creative Commons Attribution Non Commercial (CC BY-NC 4.0) license, which permits others to distribute, remix, adapt, build upon this work non-commercially, and license their derivative works on different terms, provided the original work is properly cited, appropriate credit is given, any changes made indicated, and the use is non-commercial. See: http://creativecommons.org/licenses/by-nc/4.0/.
Statistics from Altmetric.com
Key messages
What is already known on this subject
Electronic health record (EHR) usability impacts on efficiency and safety.
Prior studies have shown that poor usability can pose a risk to patient safety whereas a highly usable and flexible system can increase efficiency and contribute to a feeling of being valued at work.
The usability of EHRs in UK EDs is not known.
The System Usability Score is a well-validated measure of usability employed across industries.
What this study adds
In this survey of emergency physicians in the UK, no EHR system implemented in UK EDs achieved average or acceptable usability standards.
Usability was associated with the EHR system and, after adjusting for the EHR system, was associated with the healthcare organisation in which the system was implemented.
Introduction
Usability is a measure of how effectively a product can be used to perform its designed function.1 Within a healthcare organisation there are numerous technology systems that practitioners use for effective healthcare delivery, and EDs have been gradually implementing electronic health record (EHR) systems since the 1970s.
There are approximately 30 million ED attendances in the UK each year. In a single-payer healthcare system like the NHS which operates across all four countries in the UK (England, Wales, Scotland and Northern Ireland) the large volume of patients accessing urgent and emergency care means that the benefits or losses caused by usability are substantial.
Information systems that are not easy to use are a threat to patient safety, are inefficient, and contribute to burn-out and an unfulfilling working life.2 3 Conversely, a system that is easy to use is a positive benefit to staff, can increase efficiency and improve safety in emergency care.4–6 While usability may seem like a nebulous concept, the International Organization for Standardization (ISO) has defined standards for usability, for example, ISO 9241. This allows manufacturers and customers to identify systems that have been appropriately tested and found to support good clinical care through good usability. Usability encompasses many aspects of user design such as consistent use of features and screen space so that an operator does not have to expend a lot of mental energy to work out how to operate a system.
The System Usability Scale,1 created in the 1980s by John Brooke, has been used in more than 1500 studies across multiple industries involving a broad range of technologies (figure 1)7–11 and is the industry standard for usability research. Valid and reliable results are achievable with fewer than 20 responses.11 The System Usability Scale ranges from 0 (worst) to 100 (best). The average System Usability Scale Score across industries is 68, which is consequently considered the threshold of acceptable usability.11 A System Usability Scale Score of 50–70 is considered marginal; products with a usability score lower than 70 should be considered candidates for increased scrutiny for improvement, and products with a usability score lower than 50 are cause for significant concern and judged to be unacceptable.9 For comparison, the mean System Usability Scale Score for graphical user interfaces (GUIs) (the types of systems used by Windows and Macintosh) is 75.9 The System Usability Scale has also been categorised into grades, such as those used in educational systems, and in this system, a score of 60–70 is a D, and below 60 an F (there is no E).8

A comparison of the adjective ratings, acceptability scores and school grading scales, in relation to the average SUS Score (adapted from Bangor et al8). SUS, System Usability Score.
The objective of this research is to determine the usability of the common EHR systems currently implemented in UK EDs using the System Usability Scale.
Methods
This was an open web-based survey run by the Royal College of Emergency Medicine (RCEM) Informatics Committee. A survey tool (REDCap, https://www.project-redcap.org/) was used to survey members and fellows of RCEM using the System Usability Scale from 25 June 2019 to 15 August 2019.12 In order to maximise exposure to the survey, it was advertised on the RCEM website, mentioned in the RCEM newsletter, tweeted by the RCEM communications team, publicised in the Emergency Medicine Journal supplement, and members and fellows were invited by email. In order not to bias respondents, the language used to publicise the survey was kept as neutral as possible, while making it clear that the survey was run by the RCEM Informatics Committee. Responses were included in the final analyses if they came from a true EHR (ie, not ‘paper’), had complete System Usability Scale Scores and came from an EHR system which had at least 20 responses.11 13
The primary outcome was usability, measured on the System Usability Scale (online supplemental material).1 14 The System Usability Scale is a survey comprised of 10 questions, each of which has a response score of 1–5. The odd numbered questions are positively framed, for example, ‘I think the system is easy to use’, and the even numbered questions are negatively framed, for example, ‘I find the system unnecessarily complex’.
Supplemental material
The System Usability Scale was treated as continuous, and dichotomised into acceptable and non-acceptable usability, using the industry average of ≥68 as the cut-off point. EHR system, country, healthcare organisation, consultant status (consultants vs non-consultants) and trainee status (trainees vs non-trainees) were a priori defined as potential predictive variables of acceptable usability. Physician grade was categorised in this way to include Staff Grade, Associate Specialist and Specialty Grade (SAS) doctors, who occupy neither training nor consultant grades. In addition, respondents were asked whether their system can link directly, or whether users have to log into a separate system, to access blood tests, X-rays, outpatient notes or primary care notes. Lastly, respondents were asked whether they wished to be contacted to take part in future usability work.
Descriptive statistics were reported as proportions for categorical data. Median SUS score’s 95% CIs were calculated using bootstrap methodology in Stata.15 Normality was assessed using histograms, quantile-normal plotting and Shapiro-Wilk testing. Skewness-kurtosis was used to evaluate reasons for rejection of the normality assumption. Non-normally distributed data were reported as medians and IQR, with 95% CIs for some medians calculated using bootstrap methodology. Associations between variables were evaluated with the χ2 (for categorical variables such as EHR system, country, healthcare organisation) or Kruskal-Wallis (for continuous variables such as the System Usability Scale) tests. For categorical analyses, where any cell value dropped below 5, Fisher’s exact test was used.
All tests were two-sided with a type 1 error level of 0.05. Because some EHR systems were seen only a few times, and four types of systems that were reported did not actually represent true EHR systems (paper, not listed, inhouse and blank), we analysed only true EHR systems with at least 20 responses. Ordinary least squares linear regression was used to evaluate the effects of multiple independent variables on the continuous dependent variable System Usability Scale.16 A multivariable linear regression analysis was limited by the large number of potential covariates, even after limiting the EHR systems to those with at least 20 responses.
Responses were downloaded from RedCap and stored in an NHS Trust password-protected networked drive. Analyses were performed in Stata V.16.1 (16MP, StataCorp, College Station, Texas, USA) and images generated using ggplot2 (Wickham, H. (2016) https://ggplot2.tidyverse.org/) in R statistical software V.3.6.2 (2019) (R Foundation for Statistical Computing, Vienna, Austria, https://www.R-project.org/). Anonymised data from the study were published on Dryad, a public access data repository.17
The study was registered at the lead site’s Clinical Effectiveness Unit as a service evaluation. All responses were anonymous. NHS research ethics committee approval was explored but not required.18 19 The survey was carried out in accordance with the Equator-Network recommended Checklist for Reporting Results of Internet E-Surveys (CHERRIES) guideline.20
Patient and public involvement
Patients and the public were not involved in the design of this study, but there is lay membership of the RCEM Informatics Committee, which was kept informed of the development of the study at all stages.
Results
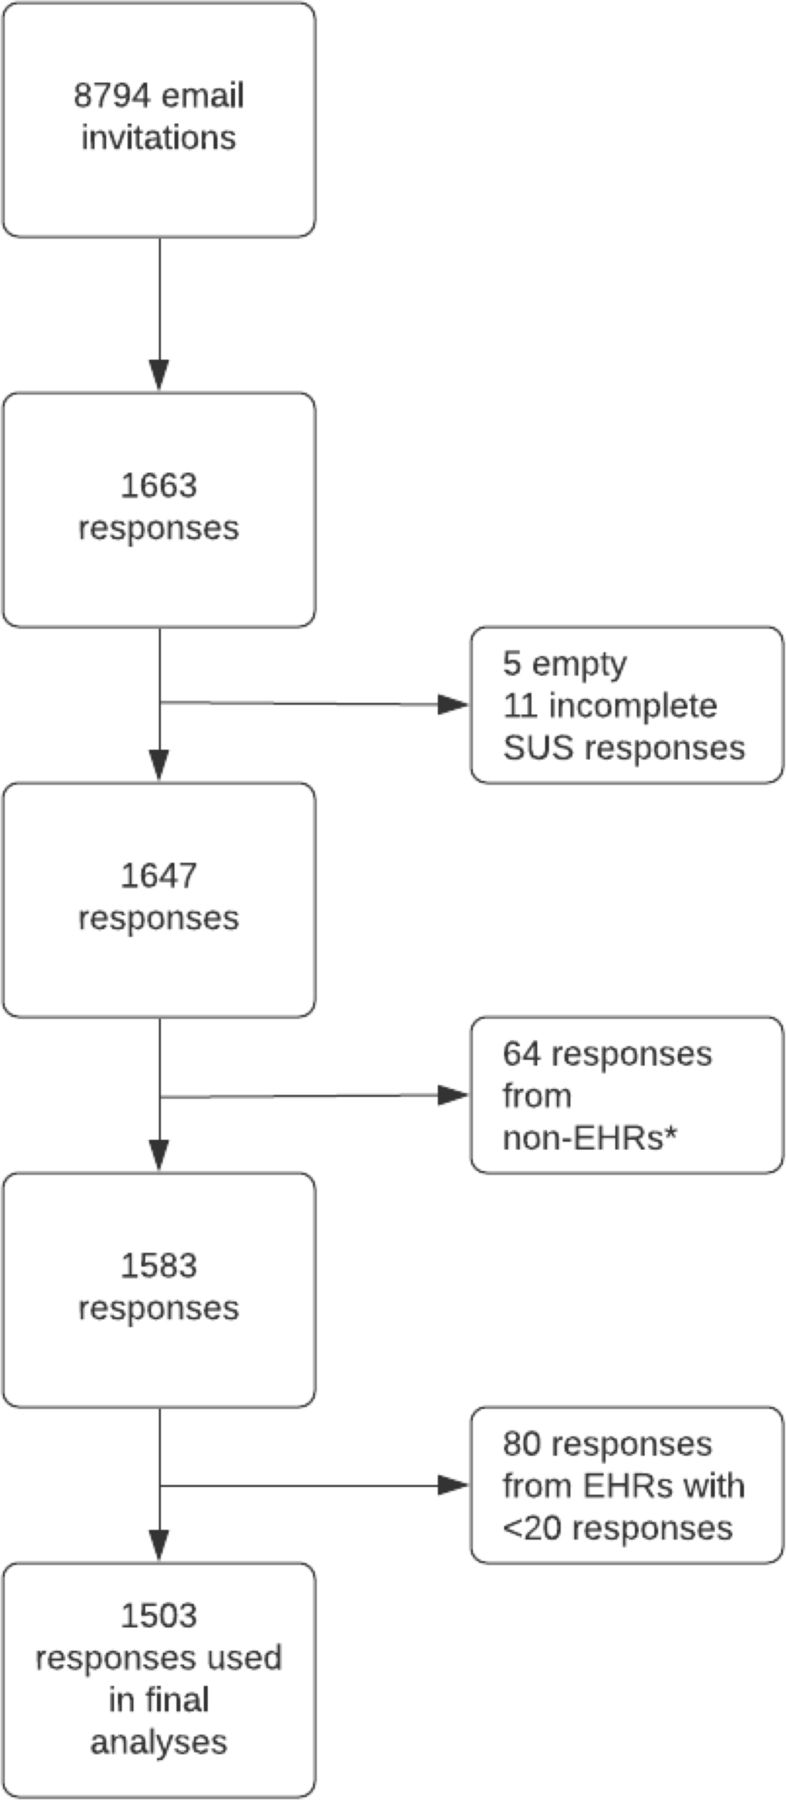
Email invitations to the survey were sent to 8794 RCEM members and fellows in summer 2019. There were 1663 (19%) responses; 11 had incomplete survey responses, 64 responses were from respondents with non-EHRs (inhouse, paper, not listed or left blank) and 80 concerned 10 EHRs with fewer than 20 responses, leaving 1503 (95.1%) responses for 15 EHR systems and 176 healthcare organisations included in the final analysis (figure 2).

Participant inclusion diagram. *paper, inhouse, not listed in survey, left blank. EHR, electronic health record; SUS, System Usability Score.
The majority (94%) of responses came from NHS Trusts in England, 2% each from Scotland and Wales, 1% from Northern Ireland and the remaining from non-UK sites (RCEM members and fellows may not be working in the UK) or British Crown Dependencies (table 1). Of all respondents, 42% were consultants (fully trained emergency physicians), 18% were emergency medicine specialty trainee years 4–6 (6–8 years postgraduation), 21% were emergency medicine specialty trainee years 1–3 (3–5 years postgraduation), 13% were SAS emergency physicians and 5% were foundation year 2 (2 years postgraduation) (table 1).
Countries, grade and number of responses to questionnaire
The median score for all responses (n=1647) was 50 (IQR 35–68). For EHRs with at least 20 responses (n=1503), the median score was 53 (95% CI 50 to 53, IQR 35–68) (table 2, figure 3). The median score ranged from 35 to 65 by EHR system (figure 3). The upper confidence limit included 68 for three EHRs. Individual System Usability Scale questions indicate that respondents found systems unnecessarily complex and cumbersome with poor integration of various functions, although they were able to learn systems quickly and were confident using them (table 3).

Point and whisker plot of median SUS by EHR provider. Whisker is 95% CI. EHRs are ordered from most to least responses (left to right). Dashed line is the average across industries and products, and constitutes low margin of acceptability. EHR, electronic health record; SUS, System Usability Score.
Median System Usability Score scores by EHR system
Responses to individual System Usability Scale questions
Among those EHRs with 20 or more responses, there was a significant association between EHRs and usability using the usability score as both a continuous or dichotomous (usability score ≥68) outcome (p<0.001).
A combination of collinearity between EHR system and the numbers of healthcare organisations resulted in healthcare organisation being discarded from linear modelling. Furthermore, reducing the EHR systems to those with >20 responses (n=15) resulted in elimination of the country variable from the model. There was no statistically significant difference in univariable linear regression analysis whether the respondent was a consultant (dichotomous) or trainee (dichotomous) (p=0.17 and p=0.33, respectively). Therefore, a univariate model was chosen to compare EHR systems’ usability scores, using the EHR system that had the lowest mean System Usability Scale Score (Atos) as the baseline. Eight EHR systems were significantly better than the EHR system with the lowest median usability score.
There was a significant association between healthcare organisation and usability (p=0.0001) (online supplemental figure 1). To test whether the association between healthcare organisation and usability was due to collinearity between the healthcare organisation and the EHR system, analyses were performed for two widely used EHR systems (Cerner and EMIS, both of which were implemented across many healthcare organisations) and then performed again but limited to organisations that returned at least 20 responses. There was a significant association between healthcare organisation and usability for healthcare organisations using Cerner, (23 organisations, p<0.001; 6 organisations with >20 responses, p<0.001), and those using EMIS (41 organisations, p<0.001; 4 organisations with >20 responses, p=0.006). These analyses suggest that usability is associated with healthcare organisations and not solely attributable to different EHR systems.
There was significant variation in whether respondents were required to access more than one system for test results. For 1 of 15 EHR systems all respondents reported they could view both blood tests and X-rays in all responses. For every EHR system, at least 80% of respondents, and for 12 systems, at least 90% of respondents, indicated that they could view blood test results within the system (online supplemental table 2). For eight EHR systems, at least 80%, and for five EHR systems, at least 90% of respondents indicated that they could see X-rays within the system (online supplemental table 2). No EHR system’s respondents indicated that there was a link to both outpatient and primary care records, but for all EHR systems, at least 80%, and for 13 EHR systems, at least 90% of respondents indicated they could view outpatient records within the system. For eight EHR systems, at least 80%, and for three EHR systems, at least 90% of respondents could view primary care records within the system (online supplemental table 3). Out of 1647 respondents, 551 (33%) agreed to be contacted for future work in this area.
Discussion
This national study of RCEM members and fellows primarily working in the NHS convincingly demonstrates substandard usability in ED EHR systems. The median usability score across all EHR systems with at least 20 responses in this study was 53 (IQR 35–68), with a range of 65–35. Only three EHRs had a median that included the industry standard of 68 within the upper bounds of the 95% CIs. Individual questions indicated that important elements of usability included having simple systems with well-integrated functions. Once adjusted for EHR system, usability was also associated with healthcare organisation, that is, there was an association between usability and individual NHS Trusts or Health Boards. This could be because different hospitals might have different implementations of common systems, for example, varying generations of a technology, or differences in the functionality purchased. Usability was not associated with physician grade or country. In our study, there was great variation in functionality with few systems having access within the EHR to both blood test and X-ray results, or to both outpatient and primary care records.
These findings are consistent with other assessments of EHR system usability. In a study of 870 responses across 18 medical specialties in the USA, the average usability score was 46 (30–60).21 This is slightly lower than in our study, however of the 54 emergency medicine respondents in that study, the score was 50, which is the same finding as in our study. In a study of usability in four EDs, two using Cerner and two using Epic, there was significant variation in number of clicks, time to complete tasks, and error rates, both between EDs and between EHR systems.22
What do the System Usability Scale Scores mean?
The usability scores from all EHRs in our study fall below the level of acceptable usability of 68, giving them a D or F grade.8 Five ED EHR systems scored lower than 50, indicating unacceptable levels of usability. In comparison, common GUIs score 75, an online banking service scored 73, and the average System Usability Scale of 10 popular smartphone apps was 78.9 11 23 24 In a meta-analysis evaluating 206 surveys of interface systems (eg, web-based, mobile phone, equipment based in users’ premises such as landline telephones), with a total of 2324 responses, fewer than 6% of the mean study scores fell below 50, compared with 33% of all EHR systems’ scores being below 50 in our study.9 In the same study, 25% of individual survey responses reported usability of 55 or lower, whereas in our study 73% of all EHR systems’ scores were below 55, that is, three quarters of systems surveyed in the UK fall in the lowest quartile of a cross-industry assessment.
Why does this matter?
A good ED IT system can significantly benefit clinical, operational (patient flow) and financial function and may actively prevent patient harm through enforcing clinical safety systems. In the UK, a large percentage of the NHS ED service is delivered by junior doctors, most of whom are only attached to the ED for 3–4 months. This frequent turnover coupled with the poor usability creates an environment with a very high training requirement.25 Unlike some other countries, in the UK there is also no direct financial pressure on clinicians to enter data accurately. To address this, in some sites in Australia, scribes have been used to reduce the burden of clerical duties such as documenting consultations, arranging tests and appointments, completing electronic medical record tasks.26 A system with poor usability is also strongly associated with physician burn-out, whereas a highly usable system, and particularly one that is flexible enough to be adaptable to feedback, can contribute to a feeling of being valued at work.4 21 Poor usability can pose a risk to patient safety. Fragmented displays can prevent coherent views of patients’ medications, and lead to prescription errors; deaths have been associated with health IT failures, and in Pittsburgh, Pennsylvania, USA a rise in paediatric mortality was coincident with a new system implementation.27–29
Within systems, there is a balance to be struck between the precision of coded data and the value of the precision, while recognising that often precision may be spurious. Data options must be precise enough to enable clinically accurate and safe communication but be easy to navigate for clinicians. This ‘Goldilocks zone’ within an ED IT system is a difficult balance to strike, but is substantially aided by a system that is very usable and presents options in a logical way that is quick to navigate. Giving clinicians access to ‘workarounds’ that avoid the need to record good data, for example, redundant or meaningless codes for diagnosis, results in meaningless and valueless data.30 To avoid this risk while enabling quality data collection, the Emergency Care Data Set (ECDS) was implemented in the NHS in England in 2018 to standardise clinical data collection. ECDS was specifically constructed to enable IT system designers to create usable interfaces, for example, by incorporating hierarchical terms for tree searches and search terms for search boxes.
We found variation in both usability and functionality within individual EHRs across healthcare organisations, but were unable to ascertain the reasons for the differences within the design of this study. A third of our respondents indicated they would be happy to be contacted for further usability work. Further research should be undertaken with users to understand in greater detail why some sites’ usability and functionality is poor compared with others with the same EHR, and to understand what characteristics of an EHR system make it most usable.
Limitations
This study presents some limitations. The response rate of 19% is low and consequently the results are open to bias, including selection bias. The proportions of respondents from the devolved nations of the UK are not equal to the proportions of RCEM members and fellows from those nations at the time of the survey, which may also have resulted in bias. However, 1647 responses is large in absolute terms, and to our knowledge this is the largest single survey of usability in emergency medicine or indeed across medical fields.31 Although our study identified poor usability in all EHRs represented, the reason for the poor usability was not described. Finally, there was significant variation in the number of responses across healthcare organisations and across EHRs represented. However, the System Usability Scale produces valid and reliable results when as few as 20 responses are returned, and so any bias resulting from low numbers of responses may have been reduced by excluding EHRs with fewer than 20 responses.9
Conclusion
In this survey of emergency physicians in the UK, no EHRs met the internationally validated standard of acceptable usability.
References
Supplementary materials
Supplementary Data
This web only file has been produced by the BMJ Publishing Group from an electronic file supplied by the author(s) and has not been edited for content.
Footnotes
Handling editor Katie Walker
Twitter @jasonpott
Contributors BMB, TCH and DRG substantially contributed to the conception and design. BMB, JP and ST substantially contributed to the acquisition and analysis of the data. BMB, TCH, ST and JP substantially contributed to drafting and revising the work. All authors gave final approval of the submitted version. All authors agree to be accountable for all aspects of the work.
Funding This work was supported by the Joint Research Methods Office of Barts Health NHS Trust.
Competing interests None declared.
Patient consent for publication Not required.
Provenance and peer review Not commissioned; externally peer reviewed.
Data availability statement Data are available in a public, open access repository. Data are stored in Dryad. Persistent url: https://doi.org/10.5061/dryad.7h44j0zsq will be available publicly if manuscript is published.
Supplemental material This content has been supplied by the author(s). It has not been vetted by BMJ Publishing Group Limited (BMJ) and may not have been peer-reviewed. Any opinions or recommendations discussed are solely those of the author(s) and are not endorsed by BMJ. BMJ disclaims all liability and responsibility arising from any reliance placed on the content. Where the content includes any translated material, BMJ does not warrant the accuracy and reliability of the translations (including but not limited to local regulations, clinical guidelines, terminology, drug names and drug dosages), and is not responsible for any error and/or omissions arising from translation and adaptation or otherwise.