Article Text

Abstract
Introduction A significant proportion of ED attendances in children may be non-urgent attendances (NUAs), which could be better managed elsewhere. This study aimed to quantify NUAs and urgent attendances (UAs) in children to ED and determine which children present in this way and when.
Methods Dataset extracted from the CUREd research database containing linked data on the provision of care in Yorkshire and Humber. Analysis focused on children’s ED attendances (April 2014–March 2017). Summary statistics and odds ratios (OR) comparing NUAs and UAs were examined by: age, mode and time of arrival and deprivation alongside comparing summary statistics for waiting, treatment and total department times.
Results NUAs were more likely in younger children: OR for NUA in children aged 1–4 years, 0.82 (95% CI: 0.80 to 0.83), age 15 years, 0.39 (95% CI: 0.38 to 0.40), when compared with those under 1 year. NUAs were more likely to arrive out of hours (OOHs) compared with in hours: OR 1.19 (95% CI 1.18 to 1.20), and OOHs arrivals were less common in older children compared with those under 1 year: age 1–4 years, 0.87 (95% CI: 0.84 to 0.89) age 15 years, 0.66 (95% CI: 0.63 to 0.69). NUAs also spent less total time in the ED, with a median (IQR) of 98 min (60–147) compared with 127 min (80–185) for UAs.
Conclusion A substantial proportion of ED attendances in children are NUAs. Our data suggest there are particular groups of children for whom targeted interventions would be most beneficial. Children under 5 years would be such a group, particularly in providing accessible, timely care outside of usual community care opening hours.
- emergency care systems
- emergency departments
- paediatrics
- statistics
Data availability statement
CUREd data may be obtained from a third party and are not publicly available. Link to data: https://www.sheffield.ac.uk/scharr/research/centres/cure/projects/cured-how-access-data.
This is an open access article distributed in accordance with the Creative Commons Attribution Non Commercial (CC BY-NC 4.0) license, which permits others to distribute, remix, adapt, build upon this work non-commercially, and license their derivative works on different terms, provided the original work is properly cited, appropriate credit is given, any changes made indicated, and the use is non-commercial. See: http://creativecommons.org/licenses/by-nc/4.0/.
Statistics from Altmetric.com
Key messages
What is already known on this subject
Demand placed on the urgent and emergency care system by children has not received the same attention as that placed by adults, despite the fact that children and younger people are higher users of ED services. A significant proportion of attendances to ED (including those in children) are for non-urgent presentations that might be better managed in other settings, variously described as inappropriate, unnecessary or non-urgent attendances.
What this study adds
Retrospective analysis of the multicentre CUREd linked dataset found that the overall rate of non-urgent attendances in children under 16 years was 21%. Non-urgent attendances were more likely to present in the youngest age categories, with over half of non-urgent attendances overall in children under 5 years. Non-urgent attendances spend less time in ED with both the mean and the median total time in department well below the 4-hour target.
Background
Unsustainable levels of demand on emergency services are an international issue.1 2 Finding solutions to the problem of demand continues to be a focus of UK government policy.3 In 2018–2019, there were 24.8 million attendances at English EDs, an increase of 4% on the previous year and over 21% since 2009–2010. This year-on-year growth in demand exceeds population growth in the same period. In the last 5 years, the number of patients spending over 4 hours in ED has trebled.4 The ambulance services are also under growing strain, with calls to the ambulance service doubling in the 10 years up to 2015 (reaching over 9 million calls).5
Demand placed on the urgent and emergency care (UEC) system by children has not received the same attention as that placed by adults, despite the fact that children are higher users of ED services.6 In 2015/2016, there were 425 ED attendances per 1000 children in the English population compared with 345 ED attendances for every 1000 adults in the population aged 25 years and over.6 Between 2006/2007 and 2010/2011, ED attendances by children (0–16 years) in the UK grew from approximately 3 million to over 4.5 million.7
A significant proportion of attendances to ED (including those in children) are for non-urgent presentations that might be better managed in other settings, variously described as inappropriate (IAs), unnecessary or non-urgent attendances (NUAs).8 9 Such attendances are a symptom of a UEC system which is not performing optimally.10 However, the evidence around methods for identifying and characterising NUAs in children is limited.11 NUAs in children may contribute to crowding in EDs, which is associated with poorer outcomes such as delays in treatment which in turn may lead to increased morbidity and mortality.12 13 NUAs reduce capacity to manage urgent cases in a timely fashion, have a negative impact on staff job satisfaction and are a poor use of scarce NHS resources.14 15
Aim
Developing and targeting interventions to manage NUAs is an increasingly important part of managing UEC demand and flow. However, to do this, we need to better understand the size of the problem, and which children present in this way, and when.
In order to achieve this aim, we undertook an analysis using an existing UEC dataset (CUREd)16 to do the following:
Define a proportion of NUAs to ED in children who were amenable to management in an alternative setting, such as primary care or urgent care centres.
Examine how these NUAs differ by patient, attendance and hospital characteristics.
Understand the impact of NUAs on waiting times in EDs.
Methods
Data collection
We used a dataset extracted from the CUREd research database.16 The CUREd Database contains linked data on the provision of care to more than one-tenth of England’s population across the socially and geographically diverse Yorkshire and Humber region. The data include A&E attendance and admitted patient care provided by all of the region’s 13 acute hospitals trusts, advice provided by the NHS 111 telephone service and care delivered by the emergency ambulance service. The CUREd research database contains over 23 million linked patient episodes of care between April 2011 and March 2017. CUREd is a unique resource which enables the investigation of patients’ care journeys across time, services and providers; from ambulance or NHS 111 call to hospital discharge.
The data used in the study comprise de-identified data on the ED attendances of all children (aged from 0 to 15 years) who attended a type 1 ED (consultant-led, multi-specialty 24-hour services with full resuscitation facilities and designated accommodation for the reception of ED patients) in Yorkshire and Humber. ED data for children in the CUREd research database were incomplete in the period 2011–2013, with missing data preventing the calculation of NUAs using our definition for a number of trusts. Thus, this analysis focused on children’s ED attendances between April 2014 and March 2017, when data were complete.
Variables extracted from the dataset were: age, sex, date of attendance, attendance category (first or follow-up attendance), trust, arrival mode (ambulance or other), disposal (including whether discharged, admitted or referred for follow-up), time of arrival, time to assessment, time to treatment and time to departure, department type (type 1, 2 or 3 ED), location of incident, clinical investigations, clinical treatments and diagnosis.
Definitions
NUAs were identified using a previously validated definition.17 This definition refers to all first-time attenders (not a follow-up attendance) to a type 1 ED who were then identified as not receiving any treatments, investigations or referrals which would require the facilities provided by a type 1 ED. A full description of the definition and criteria for identifying NUAs can be found in online supplemental file 1.
Supplemental material
For the purposes of our study when analysing the impact of time of day, we defined an out-of-hours (OOHs) period and an in-hours period. In hours was as follows: 08:00–18:00, Monday–Friday.
Statistical analysis
Summary statistics for NUAs were examined by the following characteristics: age at arrival, mode of arrival, time of arrival and deprivation (Index of Multiple Deprivation (IMD) quintile 2015).18 IMD calculates the relative deprivation for small areas in England based on seven domains and then ranks the areas from 1 (most deprived area) to 32 844 (least deprived area). These ranks are then used to determine the quintiles. Logistic regression was used to calculate odds ratios (OR) that were used to compare NUAs and urgent attendances (UAs) within different characteristics. Summary statistics were also used to compare the waiting time, treatment time and total department time for NUAs and UAs.
Patient and public involvement
There was no patient or public involvement in this study.
Results
Attendance type
There were a total of 1 068 598 ED attendances from children aged 0–15 years across 13 acute hospital trusts, between April 2014 and March 2017. Of these attendances, 91.5% (977 907) were a first-time attendance and of those, 21.4% (208 788) were classified as NUAs (figure 1).
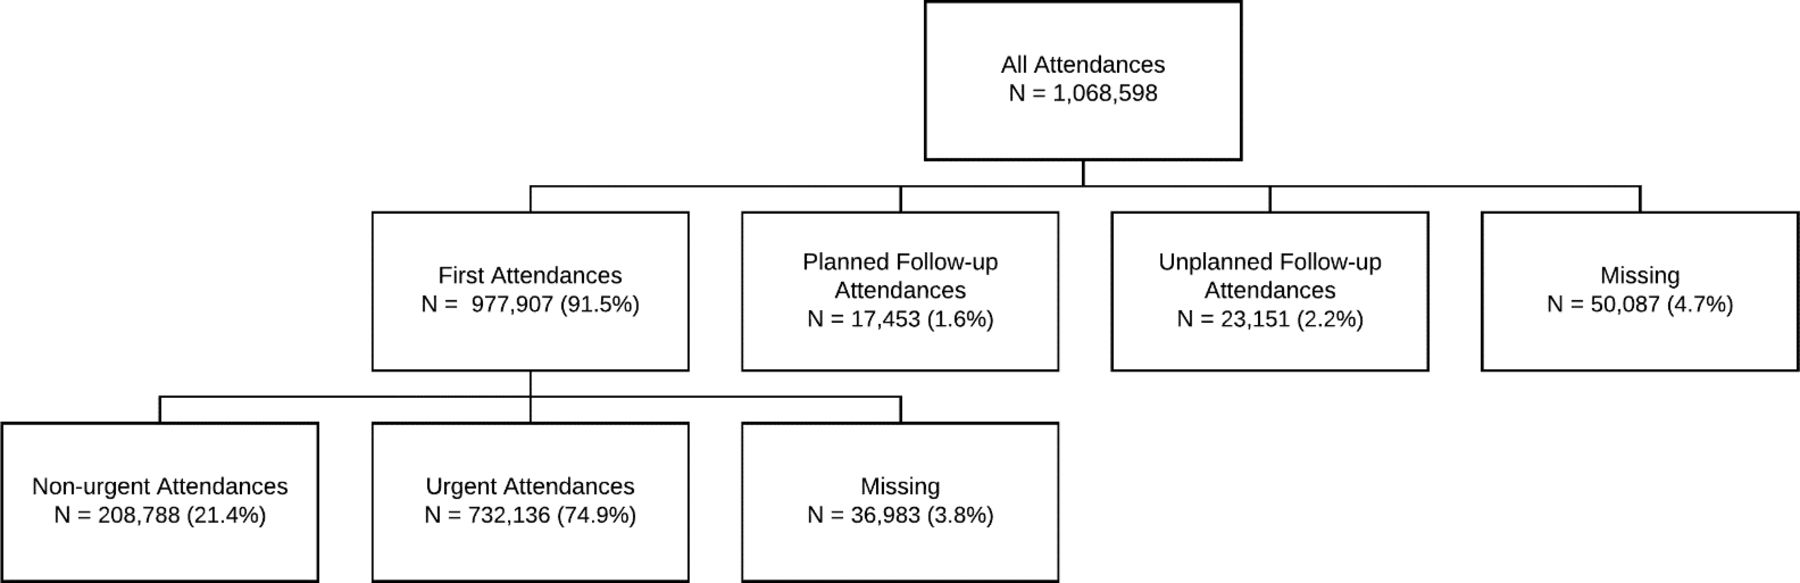
Classification of all attendances.
Characteristics of NUAs
Age at arrival
The proportion of attendances among children who are NUAs decreases as age increases (table 1). The odds were all significantly reduced for all age categories compared with those under the age of 1 year, with the odds decreasing by age group.
Total attendances, NUAs and UAs by age
Deprivation
The proportions of NUAs in each IMD quintile are fairly similar (table 2). The odds of being in the non-urgent group were reduced for each quintile when compared with the most deprived quintile.
Attendance type by IMD quintile
Mode of arrival
NUAs varied according to mode of arrival (table 3). Of the patients arriving by ambulance, approximately one in six was identified as NUA. The odds of a patient being an NUA were significantly lower if arriving by ambulance compared with other methods.
Attendance type by mode of arrival
Time of arrival
The odds of a patient being an NUA were significantly higher for those who attended OOHs compared with in hours (OR 1.19, 95% CI: 1.18 to 1.20).
Figure 2 shows the number and distribution of first-time attendances (figure 2 (top)) and the percentage of attendances that were non-urgent (figure 2 (bottom)) by day of week and time of day. There is a ‘double peak’ in numbers of first-time attendances across each day of the week, with the first at around midday and the second around 18:00 (start of OOHs). A similar ‘double peak’ pattern is seen Monday–Friday in the percentage of children who are NUAs, although at different time points, with a first peak in the early afternoon and the second, highest peak of NUAs around 23:00–01:00.
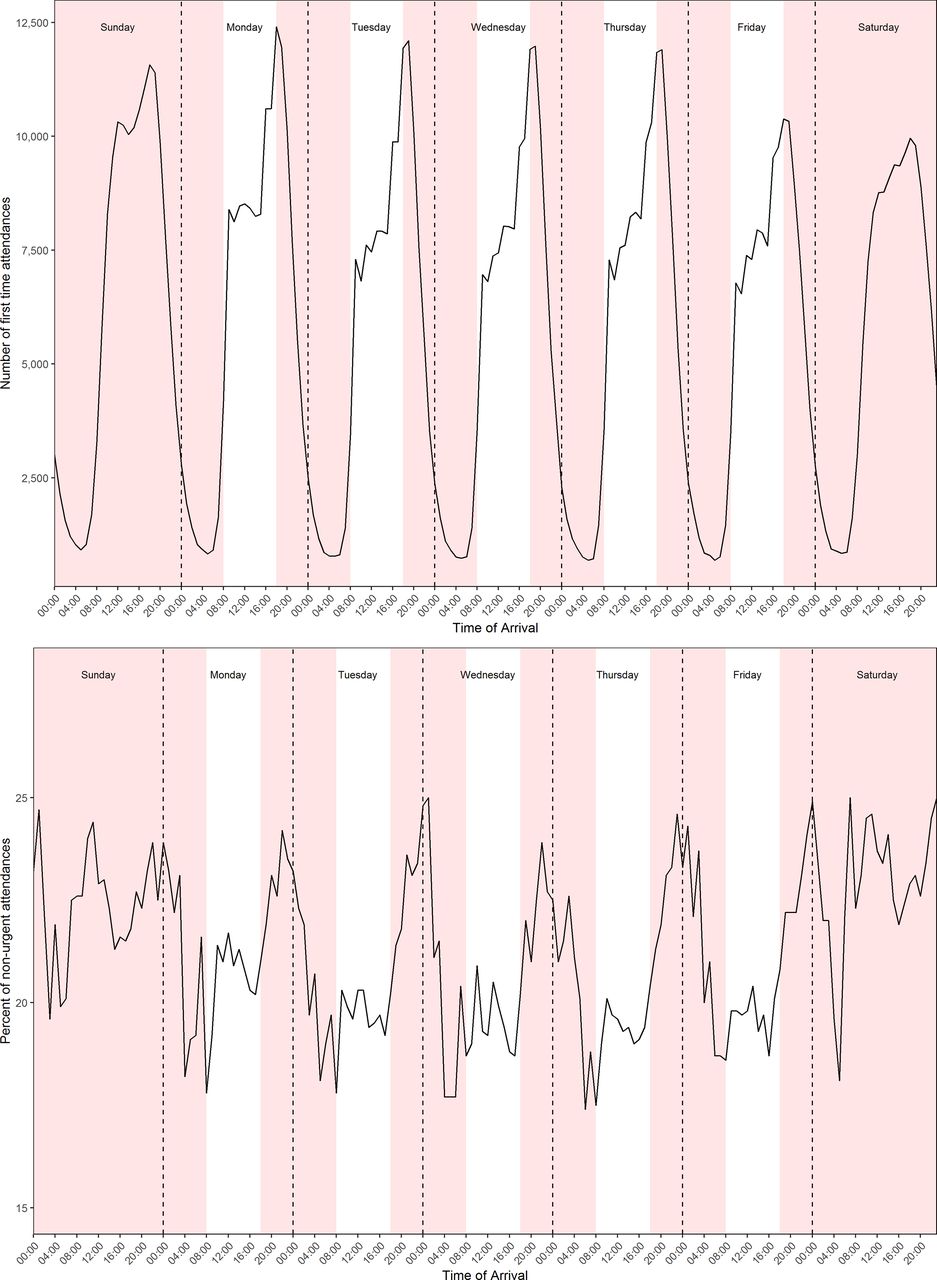
Proportion of all first-time attendances (top) and non-urgent (bottom) by day of the week and time of the day (red: out of hours).
NUA by age and time period of arrival (in hours and OOHs)
Younger NUA children have a higher proportion of OOHs compared with the older age groups (table 4). For NUAs, the odds of attending OOHs generally decrease as age increases when compared with the youngest age group.
NUAs by age and time period of arrival
Ambulance NUA arrivals by age and time period of arrival
Figure 3 presents NUAs who presented by ambulance, stratified by age group and arrival time. For NUAs, the two younger age groups were more likely to present OOHs in an ambulance, whereas the older three age groups were generally more likely to present in hours. Children in the age category 1–5 years were most likely to be non-urgent ambulance attendances.

Ambulance non-urgent attendance arrivals by age group and time period.
ED performance indicators by attendance type (NUA or UA)
Table 5 presents the waiting, treatment and department times for NUAs and UAs. NUAs have shorter times than UAs by all three measurements. Both the mean and the median for NUAs are below the 4-hour target, more so than the UAs.
ED waiting times, treatment times and total department times by attendance type (urgent or non-urgent)
Discussion
This retrospective cohort study used 3 years of routine data to understand the characteristics and patterns of children’s NUAs in a single English region. The overall rate of NUAs was 21.4%. NUAs were more likely to present in the youngest age categories, with over half of NUAs overall in children under 5 years of age. There were more NUAs in the OOHs period than the in-hours period. This OOHs effect was more prominent in the younger aged children. The youngest NUAs (under 5 years) are more likely to arrive by ambulance, particularly in OOHs. NUAs are seen more quickly in ED across all time measures, with both mean and the median total time in department for NUAs well below the 4-hour target, more so than for UAs.
Comparability of our findings
A recent systematic review of 31 studies of non-urgent presentations to the ED found considerable variation in NUAs (12%–65%), with a mean proportion of 41%.19 Other studies have also reported rates of over 40% for ‘IA’ or ‘low-acuity visits’.11 20 21 This variation in reported rates is partly explained by differences in the study criteria for identifying IAs or NUAs. A variety of criteria are used in the literature, including resource use in the ED, triage scoring and clinician judgement. Few studies use the criteria and methods used in our study, whereby an algorithm is applied to large routine datasets. Another UK study using similar criteria and methods found a more closely comparable rate of ‘IA’ in those aged 0–16 years old of 15%.22 This proportion of such attendances and our study rate of NUAs is around half that of other studies using either triage category scores assigned routinely by nurses on attendance,20 or retrospective clinician judgement of clinical records.11 21
Other studies found a relationship between younger age in children and higher rates of lower acuity attendances.19 22 Only one of these studies reported the age groups with highest rates (1 and 2 years old),22 while in our study the highest rate of NUAs was in under 1s. Our finding of a greater number of NUAs attending OOHs has also been found in other studies.20 23 Other predisposing factors associated with non-urgent presentations in the literature, which we were not able to measure in our study, were black race, lower parental education and lower health literacy in caregivers.19
Clinical implications
This study has provided an epidemiological picture of children’s NUAs in a large region of England. Extrapolating our study finding of a rate of NUA of 21.4% to the 5 million attendances for children in England in 2018–2019 for ages 14 years and under equates to approximately 1 million NUAs to type 1 EDs in England in this period in this age group alone.
The reasons parents and carers attend the ED with problems that could be managed in a community setting are multifactorial and complex. Problems with accessibility of primary care services have been cited in a number of studies, although the link between ease of primary care access and non-urgent presentations to the ED is inconsistent.19 23 24 In addition, long waits for appointments in primary care may contribute to poor patient experience,23 contrasting with the short wait times and total time spent in ED by children found in this study. Other ED advantages over primary care, such as resources, convenience as a ‘one-stop shop’ and flexibility in terms of time of access may better meet the needs of the modern caregiver.25 26
Enhanced primary care or new models of care are a priority for children’s services in England.22 Our study findings support the need for improved community response for low-acuity presentations, which while not meeting the criteria of requiring an ED level of care, are perceived as requiring an urgent response by the parent/caregiver. This response needs to be timely, at the time of day when required and provide complete urgent care needs to reduce the need for onward referral. While the majority of NUAs in our study were outside of normal NHS primary care hours, a large number were also ‘in hours’ and existing primary care provision would be suitable for a proportion of these attendances.
We also found that the waiting, treatment and department times were all shorter for NUAs compared with UAs. This is time and resource that could have been used on a UA. As NUAs are by definition non-urgent, you would expect/hope that the UAs have a shorter waiting time, but this was not seen in the data. However, seeing the NUAs more quickly may reduce crowding in the departments.
Strengths and limitations
Although the dataset is large, the data were obtained from one region in the UK, the Yorkshire and Humber region, and only include attendances up to March 2017. This may not be representative of the UK picture overall. However, this region is made up of a mixture of large urban, small urban, suburban and rural settings, it also has a population of 5.5 million and 13 acute trusts including four major trauma centres. Given this, we consider the setting to be generalisable to the UK population. Nevertheless, as the data analysis was retrospective, the observed trends may not be representative of the current local practices.
There were some limitations to our retrospective definition of NUA. It assumes that all treatments and investigations the patient received were clinically necessary. Under this assumption, the true rate of NUAs may be underestimated as there may be a tendency to use available treatments and investigations in ED. The NUA definition does not take into account the potential benefit of an observation period in ED, without any investigations or treatments, as a means of reassuring worried parents; our definition does not assess parental perception of the urgency of their child’s problem or the structure of the NHS system, for example, what services were available at the point to contact. However, the strengths of the definition are that it is validated, objective and easily reproducible as it is based on the processes of care that the patient received when they attended the ED.
Another potential limitation of the study is the limited ability to case-mix adjust, this could have been helpful to explore further specific subgroups of patients suitable for different types of community provision. This is due to the data quality, particularly presentation and diagnosis.
Finally, there is some inconsistency across studies on the OOHs times. For this study, we used 18:00–08:00 so that the OOHs times coincided with general practitioner (GP) closing times. This may be a limitation as comparisons with other studies may be difficult.
Further research
Our definition does not take into account the availability of alternatives to ED for urgent care (in addition to GPs), such as walk-in centres or urgent care centres; evaluating the impact of targeted interventions to educate the populations on the full range of services available to them for NUAs could be of use. A better understanding of the types of presentations that comprise NUAs within different age categories of children would help understand which services are required. The new emergency care dataset may assist with this by providing better quality data on presenting complaint and diagnosis of ED attendances. Our finding that younger children are more likely to have NUAs compared with older children needs further exploration. As the CUREd Database contains various linked dataset, it would be of interest to explore this NUA population further to see whether these children had been previously seen and whether they received further care later on. Also, following on the work from Lewis et al, it would be of interest to explore whether NHS 111 had any influence on these visits.27
Conclusion
This study has shown a large number of ED presentations in children within a large English region are NUAs and do not require the care provided by a type 1 ED. Our data suggest there are particular groups of children for whom targeted interventions would be most beneficial. Children under 5 years would be such a group, particularly in providing accessible, timely care outside of usual community care opening hours.
Data availability statement
CUREd data may be obtained from a third party and are not publicly available. Link to data: https://www.sheffield.ac.uk/scharr/research/centres/cure/projects/cured-how-access-data.
Ethics statements
Patient consent for publication
Ethics approval
The CUREd Database has approval from the National Health Service (NHS) Research and Ethics Committee, overseen by the NHS Health Research Authority’s Research Ethics Service, and from the NHS Health Research Authority (HRA), directly, to receive health and social care data without patient consent for patients of emergency and urgent care services in Yorkshire and Humber. The Leeds East REC granted approval (18/YH/0234) and, subsequent to receiving a recommendation to approve from the Confidentiality Advisory Group (18/CAG/0126, previously 17/CAG/0024), the NHS HRA provided approval for English health and care providers to supply identifiable patient data to the study. The study complies with the common law of duty of confidentiality owed by health professionals in regard to information provided by patients in the course of clinical care; the General Data Protection Regulation as enacted in the UK by the Data Protection Act 2018; and, where applicable, the Statistics and Registration Service Act 2007.
References
Supplementary materials
Supplementary Data
This web only file has been produced by the BMJ Publishing Group from an electronic file supplied by the author(s) and has not been edited for content.
Footnotes
Handling editor Gene Yong-Kwang Ong
Twitter @ProfSueMason
Contributors SMM, CO'K, RMS, RMJ and TS conceived the study. CO'K performed the background searches. Data linkage was performed by TS and statistical analysis of results by RMS. Interpretation of data was performed by RMS, RMJ, SMM, CO'K, TS and AH. RMS and CO'K drafted the initial manuscript and all authors contributed to its revision. SMM is acting as guarantor.
Funding This report is an independent research funded by the National Institute for Health Research Yorkshire and Humber ARC.
Disclaimer The views expressed in this publication are those of the author(s) and not necessarily those of the National Institute for Health Research or the Department of Health and Social Care.
Competing interests None declared.
Provenance and peer review Not commissioned; externally peer reviewed.
Supplemental material This content has been supplied by the author(s). It has not been vetted by BMJ Publishing Group Limited (BMJ) and may not have been peer-reviewed. Any opinions or recommendations discussed are solely those of the author(s) and are not endorsed by BMJ. BMJ disclaims all liability and responsibility arising from any reliance placed on the content. Where the content includes any translated material, BMJ does not warrant the accuracy and reliability of the translations (including but not limited to local regulations, clinical guidelines, terminology, drug names and drug dosages), and is not responsible for any error and/or omissions arising from translation and adaptation or otherwise.