Article Text

Abstract
Background Pulse oximeters are a standard non-invasive tool to measure blood oxygen levels, and are used in multiple healthcare settings. It is important to understand the factors affecting their accuracy to be able to use them optimally and safely. This analysis aimed to explore the association of the measurement error of pulse oximeters with systolic BP, diastolic BP and heart rate (HR) within ranges of values commonly observed in clinical practice.
Methods The study design was a retrospective observational study of all patients admitted to a large teaching hospital with suspected or confirmed COVID-19 infection from February 2020 to December 2021. Data on systolic and diastolic BPs and HR levels were available from the same time period as the pulse oximetry measurements.
Results Data were available for 3420 patients with 5927 observations of blood oxygen saturations as measured by pulse oximetry and ABG sampling within 30 min. The difference in oxygen saturation using the paired pulse oximetry and arterial oxygen saturation difference measurements was inversely associated with systolic BP, increasing by 0.02% with each mm Hg decrease in systolic BP (95% CI 0.00% to 0.03%) over a range of 80–180 mm Hg. Inverse associations were also observed between the error for oxygen saturation as measured by pulse oximetry and with both diastolic BP (+0.03%; 95% CI 0.00% to 0.05%) and HR (+0.04%; 95% CI 0.02% to 0.06% for each unit decrease in the HR).
Conclusions Care needs to be taken in interpreting pulse oximetry measurements in patients with lower systolic and diastolic BPs, and HRs, as oxygen saturation is overestimated as BP and HR decrease. Confirmation of the oxygen saturation with an ABG may be appropriate in some clinical scenarios.
- patient support
- respiratory
- assessment
- clinical management
Data availability statement
No data are available. These data are not available for sharing as a consequence of the UK law.
This article is made freely available for personal use in accordance with BMJ’s website terms and conditions for the duration of the covid-19 pandemic or until otherwise determined by BMJ. You may use, download and print the article for any lawful, non-commercial purpose (including text and data mining) provided that all copyright notices and trade marks are retained.
https://bmj.com/coronavirus/usageStatistics from Altmetric.com
WHAT IS ALREADY KNOWN ON THIS TOPIC
Although the UK Medicine and Healthcare Products Regulatory Agency cautions on the impact of poor peripheral blood circulation reducing the signal of pulse oximeters in hypovolaemia, there are no data on possible measurement error of oxygen saturation measurements from pulse oximetry across a range of BPs.
WHAT THIS STUDY ADDS
Throughout the range of systolic BPs of 80–180 mm Hg, there was an inverse association with the accuracy of pulse oximeters on measuring oxygen saturations. Similar associations were observed for diastolic BP and HR.
The accuracy of pulse oximeters decreases with lower systolic and diastolic BPs with a linear relationship, with a tendency to provide overestimates of the true blood oxygen saturation.
HOW THIS STUDY MAY AFFECT RESEARCH, PRACTICE OR POLICY
Low blood pressure is associated with increased measurement error for oxygen saturation measurements obtained from pulse oximeters. This may impact on clinical decision making and the thresholds used in early warning scores.
Introduction
Over the recent decades pulse oximetry has become a very common tool in monitoring patients and informing clinical decision-making. The pulse oximeter provides regular non-invasive measurements of blood oxygenation and is used in a wide range of clinical settings ranging from hospital inpatients, clinical care outside hospital and also by patients for self-monitoring in the home.
Pulse oximetry uses the difference in the detection of two separate infrared light wave frequencies through translucent perfused tissue, due to differential light absorption by oxygenated or deoxygenated haemoglobin. The ratio of these differences can be used to calculate blood oxygen saturations in a non-invasive manner.1 As such, there is a cardiovascular component to the generation of this signal, as differences in the rate of blood flow to the capillary bed may modify the equilibriums of both oxygen delivery and extraction by metabolically active tissue, and hence the measurement of oxygen saturation generated by the pulse oximeters. The UK Medicine and Healthcare Products Regulatory Agency has identified ‘low perfusion’ as a factor that may modify the accuracy of pulse oximeters in measuring blood oxygen saturations,2 but no studies have explored how this association may be modified within the normal range of BP measurements in acutely unwell patients. It is important that the evidence base for the routine use of pulse oximeters as non-invasive measurements of oxygen saturation is well understood, as they contribute to early warning scores that may trigger clinical review and escalation,3 as well as having the large benefit for both patients and staff of minimising the use of ABGs.
We used data from a cohort of patients with COVID-19 infection who were admitted to a large UK-based teaching hospital to explore the differential in blood oxygen levels as measured by pulse oximetry and ABGs and how this changes with systolic BP, diastolic BP and HR, within the ranges of values that are commonly observed in clinical scenarios.
Methods
The study design was a retrospective cohort study using routinely collected electronic data for all consecutive patients admitted to Nottingham University Hospitals NHS Trust between 1 February 2020 and 31 December 2021 with either suspected or confirmed COVID-19 infection. Oxygen saturations from ward oximetry measurements are recorded routinely electronically using Nervecentre (http://nervecentresoftware.com/), and ABG measurements are automatically uploaded to the hospital enterprise data warehouse.
Pulse oximetry measurements with a paired blood gas measurement within a 30 min time window were used as the primary outcome, with a sensitivity analysis restricting to a 10 min interval. The intervals allow time for the travel between wards where the patient was situated to the blood gas analyser followed by the processing of the sample. Oximetry measurements within intensive care units (ICUs) were not included in this study as these were not available electronically. Complete case-only analyses were performed on only those patients with ABGs available, and multiple paired ABGs and pulse oximetry measurements were allowed where available per patient. Patients without ABGs being taken were likely to be too different from this complete case cohort, and therefore imputation would have been invalid for this study.
Mean and SD for differences between pulse oximetry and ABG oxygen saturation were stratified by patient demographics recorded at baseline admission. Paired pulse oximetry and arterial oxygenation saturation measurements were matched with cardiovascular parameters taken during the same time period as the pulse oximetry. As the aim of the study was to study the accuracy of the pulse oximetry measurements across the range of systolic and diastolic BPs observed in routine clinical practice, the range of interest was 80–180 mm Hg for systolic BP, 50–110 mm Hg for diastolic BP and 50–120 beats per minute for HR.
The pulse oximetry arterial oxygen saturation difference (pulse oximetry minus ABG oxygen saturation) from paired blood samples was calculated and this was the outcome measure of interest. This difference was then plotted against each cardiovascular parameter as a continuous variable to visually assess the shape of the relationship, and linearity checked by comparing the fit of the linear model against a categorical model that used quartiles of the cardiovascular exposures and a likelihood ratio test to compare the fit of the models. As the associations were linear (p=0.82 for systolic BP, p=0.86 for diastolic BP, p=0.20 for HR; bootstrapped general likelihood ratio tests), linear models were used for the main statistical analysis.
Mixed-effects models of the association between the difference between pulse oximetry and blood gas oxygen saturation with each cardiovascular parameter were fitted using a random intercept for each patient to allow for repeated measurements. The continuous cardiovascular parameters were fitted as a linear variable. These mixed-effects models were then adjusted sequentially for age, sex, body mass index (BMI), smoking and ethnicity (fixed effects), and any covariate that altered the association between each cardiovascular parameter and the difference in saturation by more than 10% was considered a confounding factor and added to the final model. The analysis used the R programming language V.4.1.2 (R Project for Statistical Computing; R Foundation) with the lme4 package. A smoothing term was fitted using a general additive model with cubic splines (k=10) using the mgcv package in R4 with ggplot25 to provide a graphical representation of the data.
Results
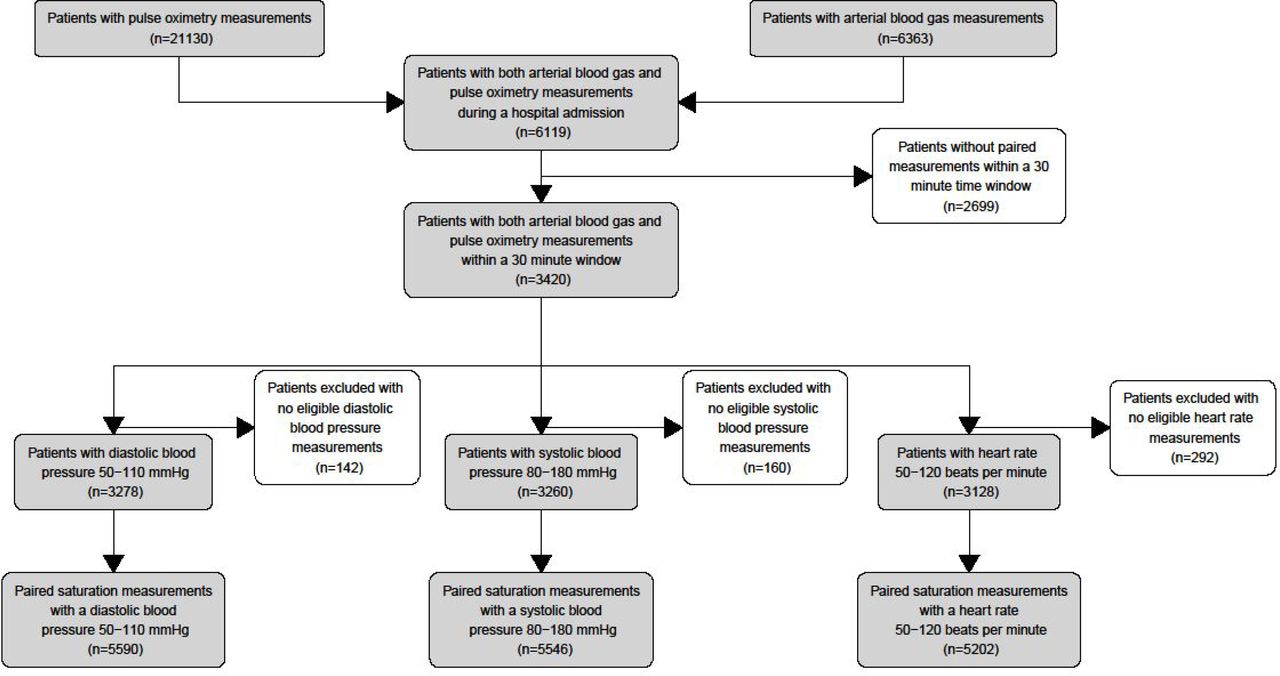
Data were available for 3420 eligible patients (figure 1), with 5927 paired oxygen saturations recorded within 30 min of an ABG (table 1). A median of two paired measurements (IQR 1–3 measurements) was observed per patient with a median time difference of 13 min (IQR 5–20 min). Of these paired saturation measurements 5864 had systolic BP measurements of which 318 were excluded as being outside the range of 80−180 mm Hg; 5864 had diastolic BP measurements of which 274 were excluded as less than 50 mm Hg or higher than 110 mm Hg; and 5924 had HR measurements of which 722 were excluded as being less than 50 and higher than 120 beats per minute.

Flow chart of patients included in the study analyses with paired samples with clinical observations within the study ranges.
Study population with the mean difference in pulse oximetry and ABG oxygen saturations in a 30 min window for paired samples
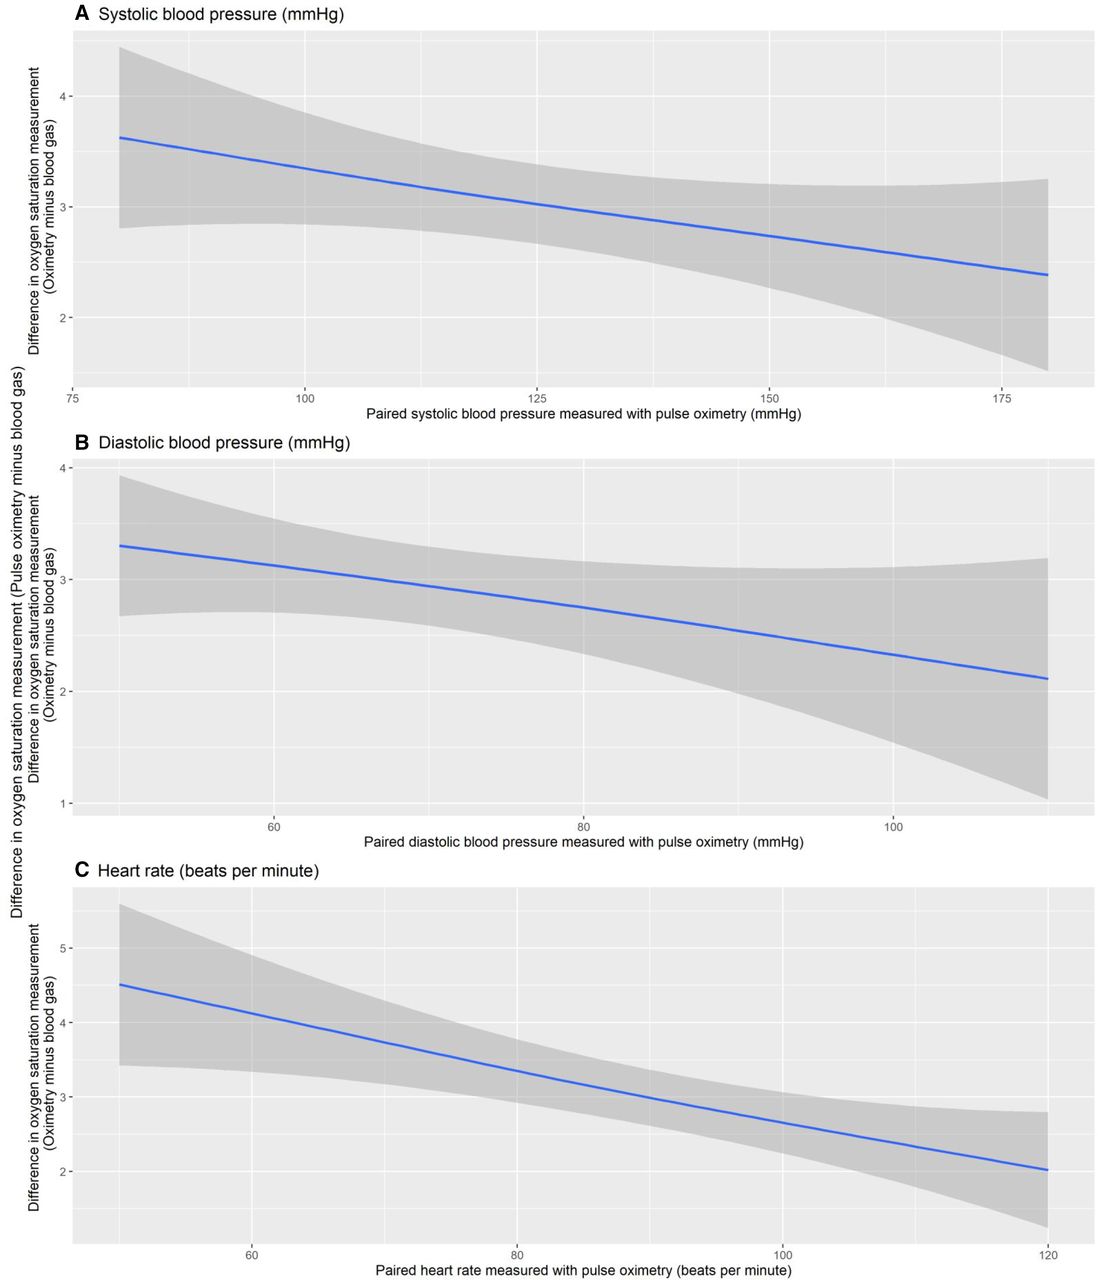
The association between the difference in oxygen saturation using the paired pulse oximetry and arterial oxygen saturation difference measurements with each cardiovascular parameter is presented in figure 2. Age, sex, ethnicity, smoking and BMI were all separately added to the model, but these were not confounding factors and therefore omitted from the final statistical model.
Paired pulse oximetry and arterial oxygen saturation differences versus cardiovascular parameters: (A) systolic BP (mm Hg), (B) diastolic BP (mm Hg), (C) HR (beats per minute). Grey band indicates 95% CI of the estimated smooth mean.
In the final analysis, the difference in oxygen saturation using the paired pulse oximetry and arterial oxygen saturation difference measurements was inversely associated with systolic BP, increasing by 0.02% with each mm Hg decrease in systolic BP (95% CI 0.00% to 0.03%); inversely associated with diastolic BP increasing by 0.03% with each mm Hg decrease in diastolic BP (95% CI 0.00% to 0.05%); and inversely associated with HR, increasing by 0.04% (95% CI 0.02% to 0.06%) for each beat per minute decrease in the HR.
A sensitivity analysis restricting the univariate analysis to samples with a 10 min window between pulse oximetry and ABG measurement (table 2) shows similar qualitative associations as in the primary analysis that used a 30 min window between the two measurements of oxygen saturation.
Three mixed-effects linear models of the difference in oxygen saturations as measured by paired pulse oximetry and ABG and their association with systolic BP, diastolic BP and HR
Discussion
This analysis of the association between the accuracy of oxygen saturation as measured by pulse oximetry within the different ranges of systolic and diastolic BPs and HRs commonly observed in clinical practice demonstrates that there is an inverse linear association between the accuracy of pulse oximeter measurements of oxygen saturations and all three cardiovascular exposures of systolic BP, diastolic BP and HR. This means that as BP or HR fell, the inaccuracy of the oxygen saturations increased.
The strengths of the analysis are that it includes data from a group of patients with a range of severity of respiratory failure with paired oxygen saturation measurements from both pulse oximetry and ABGs, along with corresponding values for BP that extended over a wide range of values. All available eligible data were analysed, thus minimising selection bias. We used demographic data on the study population to exclude the possibility that our analysis was confounded by age, sex, ethnic group,6 BMI or cigarette smoking status. One limitation of the analysis is using an opportunistic data set of patients with available paired oxygen saturations that have been collected as part of the process of delivering normal clinical care as opposed to a random sampling approach which would represent the ideal study design. The sensitivity analysis demonstrated little qualitative change in the signals observed in the main statistical analysis, suggesting that the timing between the two paired measurements of oxygen saturation does not explain the associations we observed. These data are likely to be generalisable to similar populations and institutions elsewhere.
The size of the associations in measurement error of oxygen saturation by pulse oximetry observed across the range of cardiovascular measurements that are commonly observed in clinical practice is worth consideration. For a systolic BP range of 80–180 mm Hg, a point estimate of −0.02 would lead to a difference of 2% measurement error across this range of BPs, while the comparable values for the diastolic BP range of 50–110 mm Hg we have studied would be 1.8%, and over the HR range of 50–120 beats per minute would be 2.8%. In terms of smaller differences that are observed clinically, each 10 mm Hg fall in systolic BP was associated with an adjusted 0.16% increase in pulse oximetry error, each 10 mm Hg fall in diastolic pressure with 0.27% increased error and each 10 beats per minute fall in HR with 0.40% increased error. Therefore, a drop in systolic BP from 135 to 110 mm Hg for the same arterial oxygen saturation (study mean 89.4%) would be associated with a misleading increase in the average measured pulse oximetry level from 92.6% to 93.0%.
The impact of manipulating systolic BP of pulse oximetry measurements of oxygen saturation has been studied in 25 mechanically ventilated patients in an ICU in 2003. Decreasing the arterial flow using a BP cuff while measuring oxygen saturation using both an arterial catheter and pulse oximeter suggested that pulse oximetry was reliable if the systolic BP was greater than 80 mm Hg, although below that value the pulse oximeter was less reliable giving oxygen saturation measurements higher than reality.7 It is worth noting that this population is very different from the one in our analysis, having a mean ABG measurement of oxygen saturation of 97.8%. A very different study population was also used to explore the impact of a non-invasive BP measurement using a cuff on pulse oximetry. This suggested that oxygen saturation as measured by pulse oximeters increases by a mean value of 2.9% during the process of recording BP,8 and hence highlights the importance of taking pulse oximetry measurements separately from measuring BP.
It is important to consider the biological plausibility in considering why we observed that lower systolic and diastolic BPs and HRs are associated with higher levels of measurement error from pulse oximeter oxygen saturation measurements in a linear relationship. It has been recognised that patients with sepsis and low BP have poor peripheral perfusion, and that this may impair the signal integrity through the translucent tissue used by the pulse oximeter. A retrospective cohort study of 88 patients with severe sepsis and septic shock reported a mean measurement error of +2.75% for pulse oximetry readings,9 which is of a magnitude similar to the errors we observed in patients with hypotension in our sample (figure 2). However, these patients with sepsis tend to have faster pulse rates as a consequence of the autonomic nervous systemic responses, which is not consistent with our analysis. Using routinely collected cardiovascular measurements, our data provide no mechanistic guidance to the interpretation of these issues, and it is possible that there is more than one process contributing to the associations observed in our data.
One possible unifying hypothesis may be the interaction between capillary blood flow and local oxygen demand and extraction; this interaction could be affected by pulse wave velocity through the nail capillary bed. Pulse wave velocity will be modified by both BP and pulse volumes and rates.
In conclusion, our data demonstrate that the measurement error of pulse oximeters is inversely associated with both systolic and diastolic BPs, as well as with HR. This may have significant implications in the assessment of patients and affect the interpretation of early warning scores. Clinicians using pulse oximeters need to be mindful of this and consider using ABG measurements of oxygen saturation when precise measurements are clinically indicated.
Data availability statement
No data are available. These data are not available for sharing as a consequence of the UK law.
Ethics statements
Patient consent for publication
Ethics approval
Approval for this work was granted via an NUH Clinical Effectiveness Team audit (reference: 21-294C) and IRAS (REC: 20/WM/0142, project ID: 282490, amendment number: SA02 20/07/21).
Footnotes
Handling editor Edward Carlton
Contributors AF and DS developed the hypothesis. JW, TC, CC, IJ, SB, SH-P and SC developed the database. CC did the statistical analysis. The first draft of the manuscript was written by AF and edited by all authors. CC is the guarantor and accepts full responsibility for the work and/or the conduct of the study, had access to the data, and controlled the decision to publish.
Funding This work was funded by the Nottingham University Hospitals NHS Trust and the University of Nottingham. The Nottingham University Hospitals NHS Trust also sponsored the study.
Competing interests None declared.
Patient and public involvement Patients and/or the public were not involved in the design, or conduct, or reporting, or dissemination plans of this research.
Provenance and peer review Not commissioned; externally peer reviewed.