Article Text

Abstract
Background Point-of-care (POC) lung ultrasound (LUS) is widely used in the emergency setting and there is an established evidence base across a range of respiratory diseases, including previous viral epidemics. The necessity for rapid testing combined with the limitations of other diagnostic tests has led to the proposal of various potential roles for LUS during the COVID-19 pandemic. This systematic review and meta-analysis focused specifically on the diagnostic accuracy of LUS in adult patients presenting with suspected COVID-19 infection.
Methods Traditional and grey-literature searches were performed on 1 June 2021. Two authors independently carried out the searches, selected studies and completed the Quality Assessment Tool for Diagnostic Test Accuracy Studies (QUADAS-2). Meta-analysis was carried out using established open-source packages in R. We report overall sensitivity, specificity, positive and negative predictive values, and the hierarchical summary receiver operating characteristic curve for LUS. Heterogeneity was determined using the I2 statistic.
Results Twenty studies were included, published between October 2020 and April 2021, providing data from a total of 4314 patients. The prevalence and admission rates were generally high across all studies. Overall, LUS was found to be 87.2% sensitive (95% CI 83.6 to 90.2) and 69.5% specific (95% CI 62.2 to 72.5) and demonstrated overall positive and negative likelihood ratios of 3.0 (95% CI 2.3 to 4.1) and 0.16 (95% CI 0.12 to 0.22), respectively. Separate analyses for each reference standard revealed similar sensitivities and specificities for LUS. Heterogeneity was found to be high across the studies. Overall, the quality of studies was low with a high risk of selection bias due to convenience sampling. There were also applicability concerns because all studies were undertaken during a period of high prevalence.
Conclusion During a period of high prevalence, LUS had a sensitivity of 87% for the diagnosis of COVID-19 infection. However, more research is required to confirm these results in more generalisable populations, including those less likely to be admitted to hospital.
PROSPERO registration number CRD42021250464
- COVID-19
- ultrasonography
- pneumonia
Data availability statement
All data relevant to the study are included in the article or uploaded as online supplemental information.
This article is made freely available for personal use in accordance with BMJ’s website terms and conditions for the duration of the covid-19 pandemic or until otherwise determined by BMJ. You may use, download and print the article for any lawful, non-commercial purpose (including text and data mining) provided that all copyright notices and trade marks are retained.
https://bmj.com/coronavirus/usageStatistics from Altmetric.com
What is already known on this subject
There is an established evidence base supporting the use of point-of-care (POC) lung ultrasound (LUS) for many acute respiratory diseases
POC LUS was shown to be useful in previous epidemics and accurate in differentiating bacterial and viral pneumoniae.
Chest radiographs have poor diagnostic accuracy for COVID-19 and increase equipment contamination and healthcare provider exposure to COVID-19.
What this study adds
This systematic review and meta-analysis of data from more than 4000 patients demonstrated that POC lung ultrasound is 87% sensitive for COVID-19 infection.
A quantitative scoring (or grading) system may be more useful for detecting COVID-19 pneumonia with ultrasound than a binary diagnostic threshold.
How this study might affect research, practice or policy
POC LUS is a useful adjunct to standard clinical evaluation of patients with suspected COVID-19 infection.
High-quality trials are required to determine the accuracy of POC LUS in more representative populations. This includes populations with reduced disease prevalence, high vaccination rates and varying transmissibility and virulence.
Introduction
COVID-19 was declared a global pandemic by WHO on 11 March 2020. As of 27 August 2021, there have been more than 214 million confirmed cases and more than 4.4 million deaths.1
There is now an established evidence base concerning the role of point-of-care (POC) lung ultrasound (LUS) in patients presenting with acute respiratory distress.2 First described in 2008, the BLUE (Bedside Lung Ultrasound in Emergency) protocol was found to be greater than 90% accurate for the underlying diagnosis of acute respiratory distress. Since then, there has been a proliferation of research into LUS which has confirmed that it is highly accurate for several respiratory conditions and often more accurate than CXR.3 4
The utility of LUS has also been described during previous viral epidemics. LUS was found to be accurate in differentiating viral and bacterial pneumonia during the influenza epidemic in 2009 and was found to be more accurate than CXR for avian influenza.5 6
Furthermore, CXR and a single initial reverse transcriptase polymerase chain reaction (RT-PCR) test have both been shown to have suboptimal diagnostic accuracy for COVID-19. In a large meta-analysis, CXR was found to be 81% sensitive and 72% specific.7 A single initial RT-PCR test has been found to have a sensitivity ranging between approximately 70% and 95% when compared with serial testing.8 While chest CT has been shown to be more accurate than CXR,7 this is neither an appropriate nor feasible test to provide for every patient, and is not recommended by the Royal College of Radiologists.9
As a result, various roles for LUS have been proposed including triage, diagnosis, prognostication and monitoring of disease progression.10 Multiple studies have demonstrated that LUS may have superior test characteristics than CXR.11–13 Furthermore, LUS is a rapid test that can be performed at the bedside, causes no radiation exposure and has good inter-operator characteristics.14 It may also have the potential to reduce nosocomial infections and healthcare provider exposure to COVID-19.15
The sonographic findings of COVID-19 pneumonia (or pneumonitis) are now well described and include pleural line abnormalities, single or confluent B-lines, small areas of peripheral consolidation (also termed sub-pleural) and in severe cases lobar consolidation with characteristic air bronchograms. These features are shared with other viral pneumoniae.16–18 The constellation of findings is also well understood with abnormalities typically bilateral and patchy,19 which may help distinguish viral pneumonia from other causes of acute respiratory failure including bacterial pneumonia,5 and those causing interstitial syndrome that share individual features but cause a different pattern and/or combination of findings. An example of this would be pulmonary oedema, which also results in B-line formation, but these are typically widespread, symmetrical and occur in the absence of pleural line abnormalities or consolidations.
A scoping review of the diagnostic utility of LUS in COVID-19 was published in August 2020, yielding 33 studies. The methodology of the included studies was generally poor and only five studies reported diagnostic accuracy. However, there was a trend towards high sensitivity and low specificity.20
Since then, we have experienced further waves of infection, and more evidence concerning the role of LUS has accumulated. The purpose of this systematic review was to evaluate the diagnostic accuracy of POC LUS in adult patients presenting with suspected COVID-19 infection compared with three commonly used reference standards used for the diagnosis of COVID-19: (1) RT-PCR, (2) chest CT and (3) aggregate final clinical diagnosis.
Methods
This systematic review was synthesised according to the Preferred Reporting Items for Systematic Reviews and Meta-analyses,21 and the protocol was registered on PROSPERO (CRD42021250464). No funding was sought for the production of this work.
Search strategy
Traditional sources of literature were searched, including Ovid MEDLINE, Embase, SCOPUS, Cochrane Library and Google Scholar. Less traditional sources were also searched including medRxiv, the pre-print server for health sciences.
A search strategy was developed in line with existing guidance22 and searches were performed on 1 June 2021 (see online supplemental file 1).
Supplemental material
Eligibility
All prospective and retrospective trials of patients over 16 years of age comparing lung ultrasonography to either RT-PCR, chest CT or a final clinical diagnosis of COVID-19 were included. Case reports, editorials and recommendation/instructional journal papers were excluded. Trials not reported in the English language were excluded from this study.
Study selection
Independent searches for titles and abstracts were carried out independently by two reviewers, both senior emergency physicians (AM, MT). A screening and selection tool (see online supplemental file 2) was agreed on and applied to identify eligible studies from both the abstract and subsequent full-text review. Disagreements reviewed by a third reviewer (RDJ). The reference lists from these studies were also reviewed to identify and further relevant studies.
Supplemental material
Definition of the index test/diagnostic threshold
Multiple scanning protocols have been described and the specific threshold of findings necessary to diagnose COVID-19 has also not been agreed on. Studies were included regardless of the number of zones scanned or the diagnostic threshold used.
Definition of the reference standard
Although a positive RT-PCR is recognised as the gold standard diagnostic test for ruling-in COVID-19 infection, it is less reliable at ruling out the disease. While RT-PCR testing is used to detect infection, LUS is used to diagnose viral pneumonia. Chest CT has been described as the reference standard for viral pneumonia23 but is infrequently used in clinical practice. An alternative to both is the use of a final clinical diagnosis incorporating imaging findings and results of serial RT-PCR tests. We have included studies using all three reference standards, and present combined and individual data.
Data collection and synthesis
Two independent reviewers (AM, MT) extracted the following data (displayed in table 1): study design and setting, exclusion criteria, number of patients, admission rate (used as a measure of disease severity), prevalence of COVID-19, sensitivity, specificity, number of true positive and negative results, number of false positive and negative results, scanning technique and diagnostic threshold (or scoring) for LUS, reference standard and blinding. Disagreements were resolved by a third independent reviewer (RDJ).
Summary of key demographic and epidemiological data as well as results from each of the included studies, arranged by sample size from highest
Quality appraisal
Two reviewers (AM, MT) independently used the Quality Assessment Tool for Diagnostic Test Accuracy Studies (QUADAS-2) to evaluate the quality of each study and risk of bias. Disagreements were resolved by a third independent reviewer (RDJ).
Data analysis
Data were analysed using a dedicated application, MetaDTA (Complex Reviews Support Unit, National Institute for Health Research, UK), a validated tool for meta-analysis of diagnostic test accuracy studies that utilises open-source packages in R (R Foundation for Statistical Computing, Vienna, Austria).24 Random-effects bivariate binomial models were used to estimate overall sensitivity and specificity and provide the hierarchical summary receiver operating characteristic (HSROC) curve for LUS. The open-source package Metafor in R was used to determine heterogeneity for univariate sensitivity and specificity analysis using a DerSimonian and Laird random-effects model, providing the I2 statistic.25 26 Combined and separate analyses were performed for each of the reference standards.
Results
Our search identified 3041 studies from traditional databases and registers, and 221 from other sources. Following removal of duplicates, eligibility screening by title/abstract and then full-text review, a total of 20 studies were included. A flow chart was produced in line with the PRISMA guidelines (figure 1).
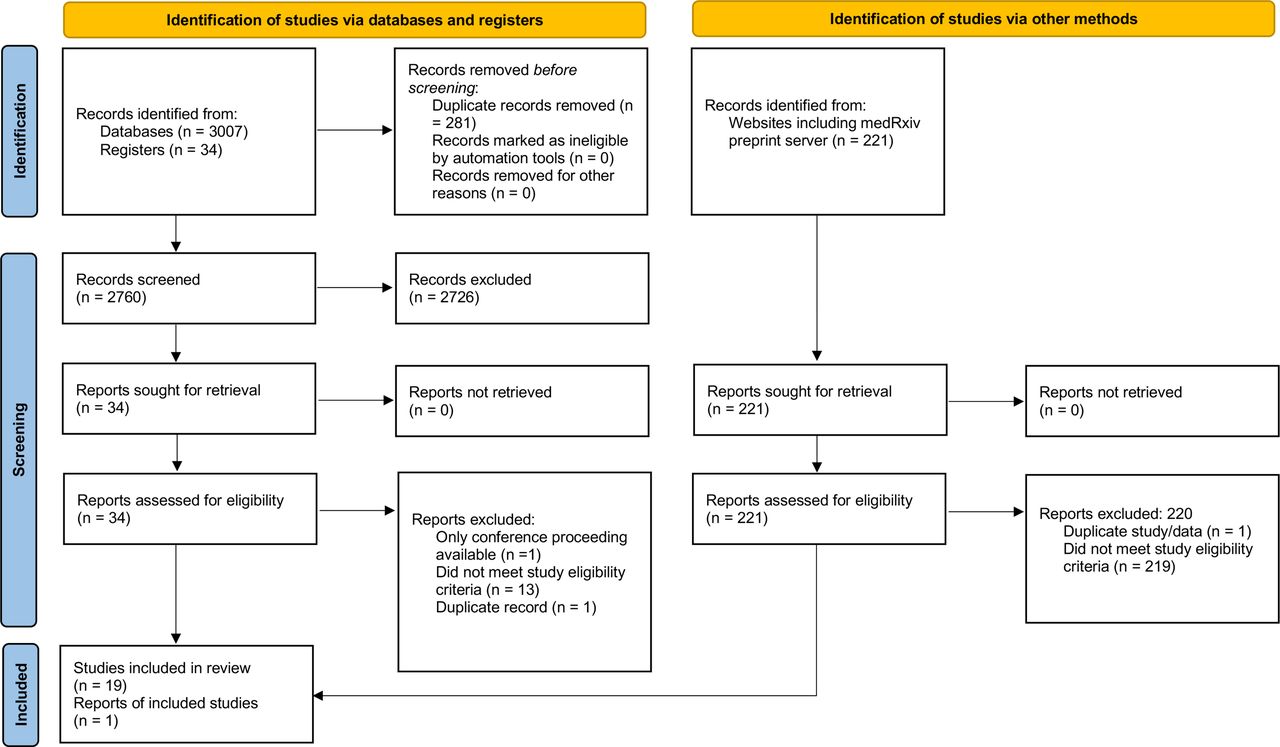
PRISMA flow diagram.
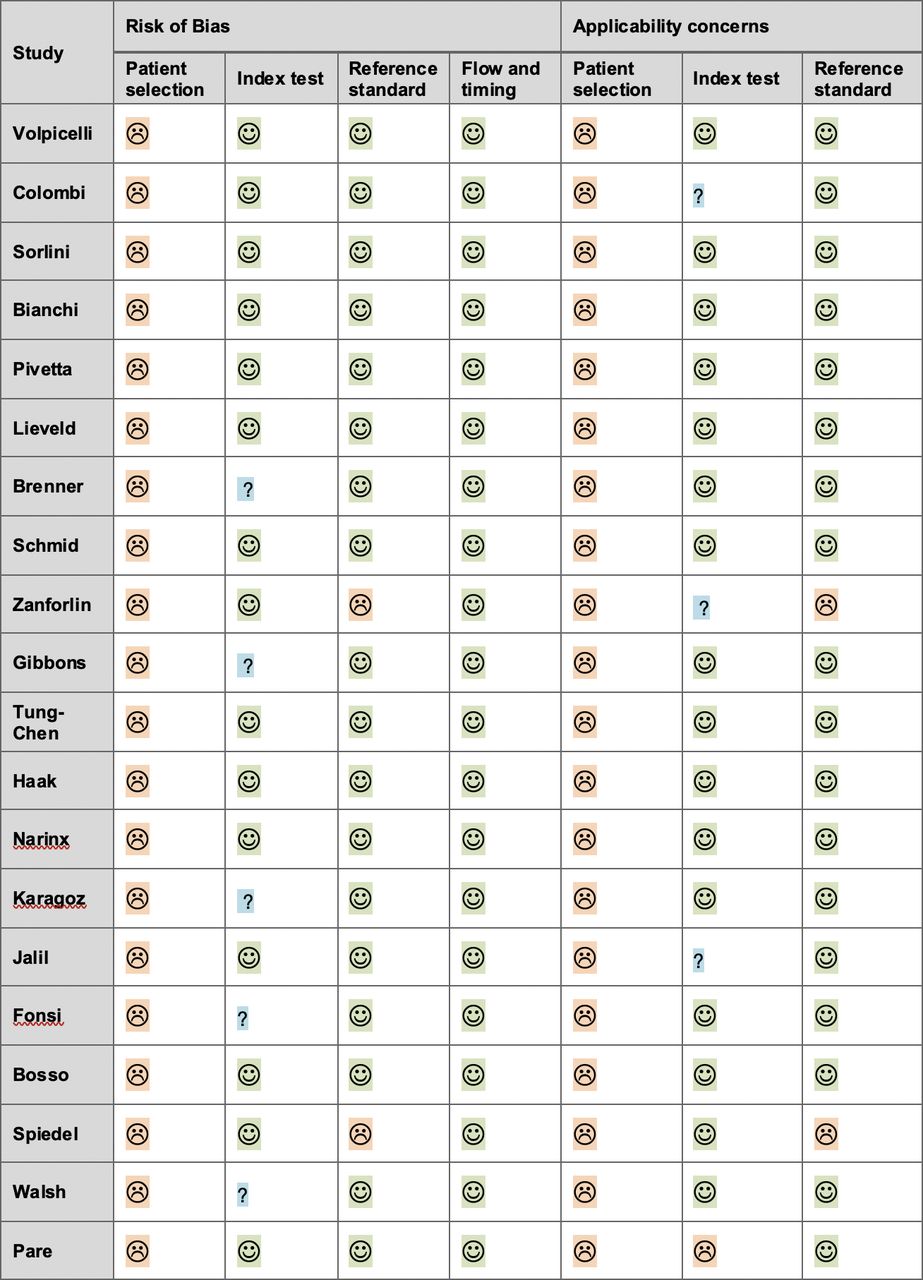
Quality appraisal
The results of the QUADAS-2 assessment are shown in figure 2.

QUADAS-2 assessment (☺ low risk, ☹ high risk, ? unclear risk). Studies arranged by sample size, from largest.
Patient selection
We determined all studies to be at high risk of selection bias. All used convenience sampling and six had exclusion criteria that introduced a risk of spectrum bias (sampling methods and exclusion criteria for each study are shown in table 1). In two studies, patients with indeterminate LUS examinations were excluded, further increasing the risk of spectrum bias. In addition, high prevalence, high rates of severe disease and hospital admission across all the studies introduced both a risk of referral bias and applicability concerns.
Index test
Overall, there was significant variation in the LUS protocols used as well as the diagnostic threshold for a positive scan. Furthermore, prior experience and training in ultrasound varied between studies. In five studies, it was not specified whether the operator was blinded to clinical information; therefore, the risk of bias was deemed unclear. One study was deemed to have applicability concerns due to the use of a low diagnostic threshold (a single B-line), which in the context of high disease prevalence may have overestimated diagnostic test performance. There were unclear applicability concerns in three studies, in which minimal or no information was given regarding prior training and experience of the clinicians performing the index test.
Reference standard
The two studies that used the final clinical diagnosis as their only reference standard were deemed to have a high risk of incorporation bias. A third study also comparing LUS with the final clinical diagnosis also provided separate comparison to RT-PCR and as such was not deemed high risk of incorporation overall.
Summary of results
An overview of the characteristics of all the included studies is shown in table 1. A total of 4314 patients were included. There was an even mix of prospective (n=11) and retrospective (n=9) studies, and all were convenience samples. The prevalence of COVID-19 infection ranged from 12% to 75%. In 16 of the studies, patients were recruited in the ED. In 4 of the studies, patients were recruited from mixed secondary care settings (ED, medical admissions ward, intensive care unit). Importantly, in these studies the LUS was performed within 24 hours of presentation and prior to results of the RT-PCR test being available.
Fifteen studies used RT-PCR as the reference standard, while five used chest CT and three the final clinical diagnosis. The smallest study included 43 patients while the largest included 1462. Sensitivity of LUS ranged between 68% and 100%, and specificity ranged between 21% and 97%.11–14 27–42
Comparison with RT-PCR testing
Fifteen studies used RT-PCR as the reference standard. In this group, sensitivity ranged between 68% and 96% while specificity ranged between 21% and 91%.11 12 14 27–38
This included the largest published study which included 1462 patients and classified patients according to their clinical phenotype: 1) mild (without dyspnoea or respiratory failure, n=402); 2) severe (with dyspnoea or respiratory failure, n=725); 3) mixed (patients with cardiorespiratory comorbidities, n=335). Furthermore, LUS studies were classified as either low, intermediate or high probability of COVID, or suggestive of an alternate diagnosis. The authors describe findings such as isolated large consolidations, large pleural effusions and a homogeneous diffuse B-line pattern as being more consistent with an alternate diagnosis.14
In the overall population, a high probability LUS demonstrated a modest sensitivity of 60% (95% CI 57 to 63) but a relatively strong specificity of 89% (95% CI 86 to 92), while combined high/intermediate LUS studies predictably demonstrated a higher sensitivity of 90% (95% CI 88 to 92) but lower specificity of 53% (95% CI 48 to 57). In patients with an ‘alternate’ diagnosis (or disease pattern) on LUS, the majority tested negative on RT-PCR (85% and 84%, respectively, for patients classified as the severe or mixed phenotype, respectively). In patients with the mild phenotype, a high probability LUS demonstrated a sensitivity of 32% (95% CI 26 to 38) and a specificity of 94% (95% CI 90 to 97). In the same group of patients, combined high/intermediate LUS demonstrated a sensitivity of 68% (95% CI 61 to 74) and specificity of 64% (95% CI 56 to 71). In those classified as having a mixed phenotype, a high probability LUS demonstrated an improved sensitivity of 68% (95% CI 61 to 74) and a specificity of 88% (95% CI 81 to 93). In this group of patients, combined high/intermediate LUS demonstrated a sensitivity of 95% (95% CI 90 to 97) and specificity of 50% (95% CI 41 to 59). In patients with the severe phenotype, a high probability LUS demonstrated an improved sensitivity of 69% (95% CI 65 to 72) and a specificity of 82% (95% CI 74 to 88). In this group of patients, combined high/intermediate LUS demonstrated a sensitivity of 97% (95% CI 96 to 98) and specificity of 39% (95% CI 31 to 48).14
Three studies compared both LUS and chest CT to the reference standard RT-PCR result. In each study, LUS demonstrated sensitivity greater than 90%, whereas the sensitivity of chest CT ranged between 69% and 90%. Both LUS and CT were less specific than RT-PCR. Specificity of LUS ranged between 21% and 66% and for CT between 43% and 80%.31 34 35
In one study, the authors compared traditional clinical evaluation to an integrated assessment incorporating POC LUS. Clinical evaluation was found to be 81% (95% CI 73 to 88) sensitive and 64% (95% CI 54 to 72) specific whereas integrated assessment with LUS was 94% (95% CI 88 to 98) sensitive and 95% (95% CI 90 to 98) specific.
Two studies adopted scoring systems for the LUS findings. Unsurprisingly, those who tested positive on RT-PCR had higher scores (optimal cut-off scores are shown in table 1).28 29 It was also demonstrated that complete (12-zone) studies were 5% more sensitive and 4% more specific than less thorough studies.29
Comparison with chest CT
Five studies (a total of 282 patients) used chest CT as the reference standard. Sensitivity ranged between 65% and 97% and specificity between 59% and 97%.13 30 37 39 40
Comparison with final clinical diagnosis
Three studies used a final clinical diagnosis as the reference standard (a total of 347 patients). Sensitivity of LUS ranged between 85% and 91% and specificity between 75% and 80%.34 41 42
Two studies adopted scoring systems for LUS and optimal cut-off scores demonstrating sensitivities above 90% and specificities above 75%.41 42
Meta-analysis
Combining all studies, LUS had an overall sensitivity of 87.2% (95% CI 83.6 to 90.2) and specificity of 69.5% (62.2 to 72.5). Forest plots for each are shown in figure 3A. Positive and negative likelihood ratios were 3.04 (2.27 to 4.06) and 0.16 (0.12 to 0.22), respectively. The HSROC curve is shown in figure 4. Heterogeneity between all studies was high, with I2 values of 71.6% (95% CI 58.7 to 91.5) and 86.8% (84.4 to 96.0) for sensitivity and specificity, respectively.
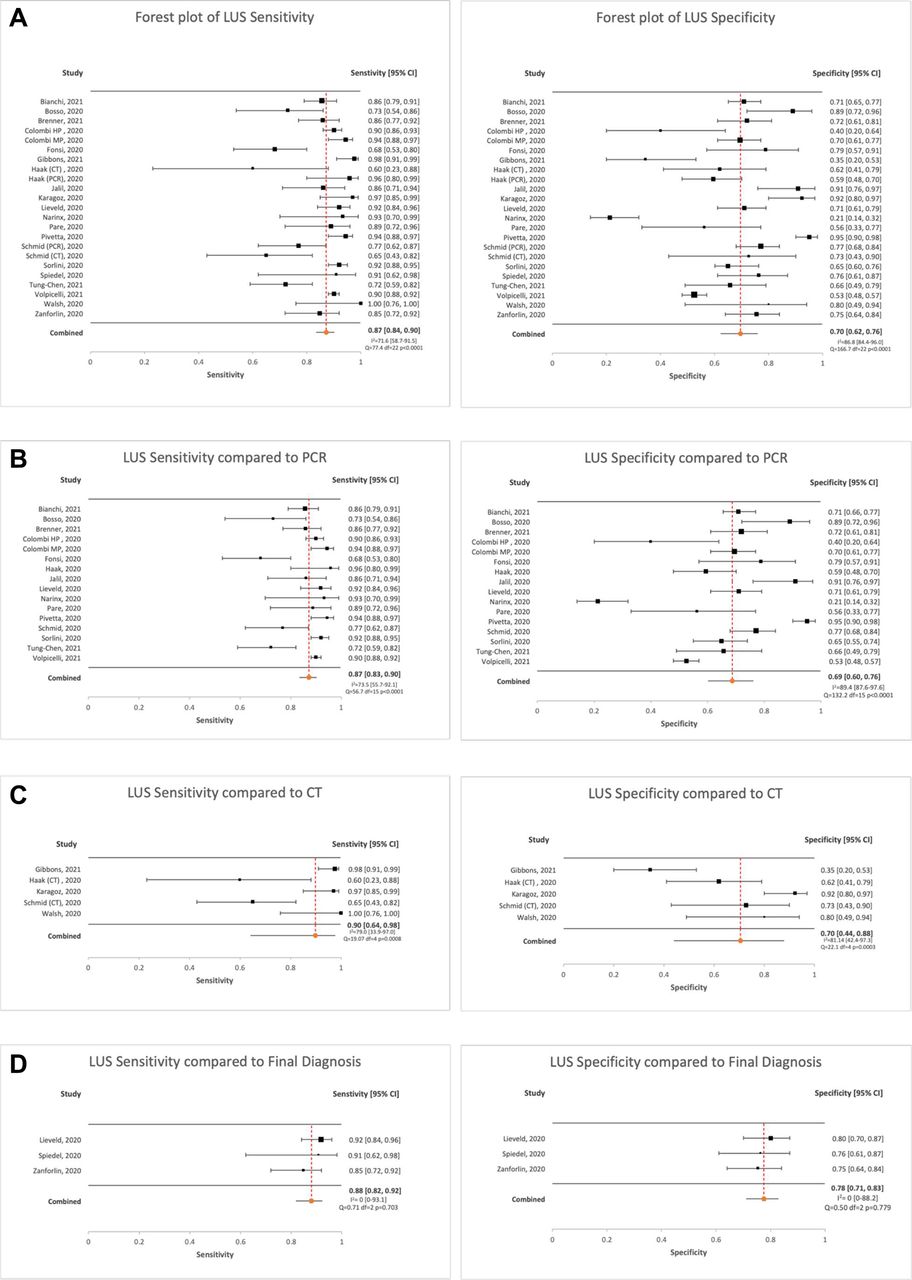
Forest plots demonstrating sensitivity and specificity of LUS overall (A) and compared with each of the three reference standards (RT-PCR (B), chest CT (C) and final clinical diagnosis (D)). LUS, lung ultrasound.

Hierarchical summary receiver operating characteristic (HSROC) curves for LUS overall (A) and compared with each of the three reference standards (RT-PCR (B), chest CT (C) and final clinical diagnosis (D)). LUS, lung ultrasound.
When only studies using RT-PCR as the reference standard were included, sensitivity and specificity remained similar at 87.2% (83.4 to 90.3) and 68.7% (60.2 to 75.3), respectively. Forest plots are shown in figure 3B. Positive and negative likelihood ratios were 2.94 (2.06 to 4.19) and 0.17 (0.12 to 0.24), respectively. Heterogeneity remained high with I2 values of 73.5% (55.7 to 92.1) and 89.4% (87.6 to 97.6) for sensitivity and specificity, respectively.
When only the five studies using chest CT as the reference standard were analysed, sensitivity increased to 89.7% (64.1 to 97.7) and specificity to 70.5% (43.9 to 87.9). Forest plots are shown in figure 3C. Positive and negative likelihood ratios were 3.24 (1.56 to 6.73) and 0.10 (0.02 to 0.47), respectively. Again, heterogeneity was high, with I2 values of 79.0% (33.9 to 97.0) and 81.1% (42.4 to 97.3) for sensitivity and specificity, respectively.
When only the studies comparing LUS with a final clinical diagnosis were examined, sensitivity remained similar at 88.0% (81.9 to 92.2); however, specificity increased to 77.6% (71.1 to 83.0). Forest plots are shown in figure 3D. Heterogeneity between these three studies was low with I2 values of 0% (0.0 to 88.1) and 0% (0.0 to 0.81).
HSROC curves for LUS compared with each of the reference standards are shown in figure 4B–D. These plot the true positive rates (sensitivity) against the false positive rates (1 – specificity) in each study, providing a graphical representation of the relationship between sensitivity and specificity, and a summary estimate for test performance.
Discussion
In this systematic review, we aimed to evaluate the diagnostic accuracy of LUS for COVID-19 infection, diagnosed either by RT-PCR testing, chest CT scan or an aggregate final clinical diagnosis. We presented data from 20 studies consisting of more than 4000 patients. The majority of studies were conducted in high-prevalence populations with high rates of hospital admission. Overall, LUS was found to be 87% sensitive but generally less specific for COVID-19 infection. The negative likelihood ratio (for ruling out disease) was reasonable; however, the positive likelihood ratio was less useful.
We reported test characteristics for LUS combining all studies and separately for the three reference standards commonly reported in the literature. However, it may be argued that in the population studied, all three are in fact comparable. The rate of hospital admission was high across the studies and therefore it would be expected that the majority of patients included presented with more severe disease and secondary complications of COVID-19, including viral pneumonia.43 Chest CT is the recognised gold standard test for viral pneumonia23 and therefore may be considered broadly equivalent to RT-PCR testing in this population. This is supported by separate analyses for each of the reference standards demonstrating similar pooled sensitivities (87–90%) and specificities (69%–78%).
It is important to remember that LUS only tests for the pulmonary manifestations of COVID-19 and its sensitivity may therefore be significantly lower in non-admitted patients with mild or non-respiratory symptoms. The choice of reference standard for comparison to LUS is therefore crucial and we recommend future research examining LUS as a screening or diagnostic test for COVID-19 infection use RT-PCR testing, whereas studies examining the accuracy of LUS at diagnosing pulmonary manifestations should use chest CT.
Although in this study we reported sensitivity and specificity, examining the positive and negative predictive values (PPV and NPV), which incorporate the effect of disease prevalence, can be useful measures of the performance of a diagnostic test. This is an important consideration given the overall high prevalence rates reported in the studies. In an era of relatively lower prevalence, the PPV of LUS may be significantly lower than has been estimated. Caution should therefore be taken when considering the application of LUS for early diagnosis, screening and cohorting patients in the setting of lower prevalence.
The included studies were largely undertaken during periods of high disease prevalence and low or no vaccination, with data collection ending in June 2020. Since this time, WHO have designated several further variants of concern, including the currently circulating Omicron variants. It is widely appreciated that both virulence and transmissibility differ between variants and as such, the emergence of the Omicron variant has resulted in reduced rates of severe disease and hospitalisation.44–46
While the rates of severe disease may vary between strains, the pulmonary complications and their radiological manifestations appear to be consistent.47 Also, these are indeed shared by other causes of viral pneumonia.5 6 In one study comparing chest CT findings in patients infected with different variants of COVID-19, while there was a difference in the severity of radiological findings, the nature and distribution of changes was similar.47 Given that LUS findings correspond well with those on chest CT,31 48 it is likely to be useful at detecting viral pneumonia caused by all strains of the disease. However, in populations with fewer manifestations of severe disease (including viral pneumonia), the sensitivity of LUS as a screening test is likely to be reduced. This should be confirmed with ongoing work during periods of reduced prevalence, high vaccination rates and changing variants.
There is a rapidly expanding evidence base demonstrating favourable characteristics for molecular and other non-RT-PCR tests for COVID-19 that are much easier and faster to perform and can turn over rapid results.8 The availability of these tests will likely impact on the value of LUS as an early bedside clinical tool.
Where there is access to rapid beside molecular testing, LUS use is likely to be most useful in certain circumstances, for instance, patients presenting with acute respiratory distress where viral pneumonia secondary to COVID-19 infection is part of a wide differential. These patients may have incidental COVID-19 infection alongside an alternative primary respiratory illness, and this is made more likely by the dominance of less virulent strains and vaccination. In these patients, the pattern of abnormal findings on LUS can be used to accurately differentiate the underlying cause of respiratory disease.3 49
Integrated LUS, used in combination with other clinical data, may also improve early diagnostic accuracy in the ED. Walsh et al showed that both sensitivity and specificity were increased when LUS was integrated with clinical findings as opposed to interpreted in isolation.13 The potential to integrate bedside imaging findings is unique to point-of-care ultrasound (POCUS) and may enhance diagnostic accuracy. This concept was exemplified by Pivetta et al when they showed that an integrated LUS approach was highly accurate in patients with acute decompensated heart failure, more so than CXR or B-natriuretic peptide levels.4
All but three studies adopted a comprehensive 12-zone LUS technique. Given that the changes observed in viral pneumonia are bilateral and patchy, scanning technique is likely to affect sensitivity. Various scanning techniques have been described ranging from only limited views of the anterior chest to a more thorough examination of each intercostal space both anteriorly and posteriorly. Brenner et al showed that when only complete 12-zone studies were included in their analysis, both sensitivity and specificity of LUS were improved.29
The heterogenous criteria are used to determine whether a positive LUS may also have affected the results of the included studies. Various thresholds were used for ruling in this diagnosis, ranging from any B-lines to a minimum number of affected zones to a minimum severity score. One study used a low diagnostic threshold for LUS, where a single B-line was deemed positive. In a population of high disease prevalence, this is likely to have overestimated diagnostic performance.12
Lower diagnostic thresholds generally favoured improved sensitivity while higher thresholds favoured specificity. While relatively common in COVID-19 pneumonia, B-lines are also commonly seen in multiple respiratory diseases.2 Intuitively, a low diagnostic threshold (eg, the presence of any B-lines) is likely to be sensitive but non-specific. Data presented by Volpicelli et al suggest that a diagnostic score weighted to the specific sonographic findings is likely to be more useful than a binary cut-off.14 We therefore propose the development of a diagnostic (as opposed to severity) scoring system. Such a system could quantify the likelihood of COVID-19 infection or pneumonia depending on how typical the pattern of LUS features. A resulting estimated likelihood ratio could then be integrated with a pre-test probability to provide the treating clinician with a post-test probability.
Study limitations
Included studies were limited to those published in the English language. In the context of an international pandemic, this may have excluded some pertinent studies. Second, there may have been a risk of publication bias and indeed, no dedicated assessment of this was made.
For both sensitivity and specificity analyses, heterogeneity was found to be high and as such the results should be interpreted with caution. This may in part be attributable to the use of broad inclusion criteria with respect to the index test. There was significant variation in the LUS protocols used as well as the diagnostic threshold for a positive scan. Furthermore, there was some variability regarding the prior experience and training of the operators. POCUS is an operator-dependent technique where a single provider is responsible for both image acquisition and interpretation. Therefore, both the specific training received, and prior experience of the scanning physicians is likely to influence diagnostic accuracy.
Searches were carried out on 1 June 2021, and the included studies reported data up until June 2020, 3 months after the declaration of the COVID-19 pandemic by WHO. Therefore, studies were limited to a period of high disease prevalence, during which admission rates with pulmonary complications and severe disease were high. As a result, the conclusions of this meta-analysis may not be generalisable to current populations, in whom the emergence of less virulent strains of disease (such as the Omicron variant) and effective vaccines have reduced both prevalence and the likelihood of severe disease.
This meta-analysis investigated the role of LUS as a diagnostic test for COVID-19 infection when rates of severe disease (including pneumonia) were high, and during a period where alternative rapid point-of-care testing was not readily available. However, our results may not be applicable to current practice where the role of LUS is less clear and more likely to be useful in diagnosing viral pneumonia than COVID-19 infection itself.
Future research
Future research should focus on wider populations, including mildly and asymptomatic patients, during periods of lower disease prevalence to define the role and setting in which LUS is most useful. As previously described, future work is required to define the optimal diagnostic threshold for LUS. Finally, further work is required to understand the training and experience required to gain proficiency in LUS.
Recommendations/conclusions
LUS was found to be 87% sensitive for the diagnosis of COVID-19 infection in a population of both high prevalence and mostly admitted patients, and may improve detection of COVID-19 pneumonia in this group compared with CXR. Indeed, four of the studies included in this meta-analysis also reported data for CXR each demonstrating LUS to be more sensitive11 12 38 39 In patients requiring admission, a normal LUS should prompt consideration of an alternative diagnosis. Although overall specificity was less optimal, the presence of a full spectrum or typical pattern of LUS findings is likely to be more specific, and as such, a quantitative diagnostic LUS scoring system is likely to be more useful than a binary threshold.
Data availability statement
All data relevant to the study are included in the article or uploaded as online supplemental information.
Ethics statements
Patient consent for publication
Ethics approval
Not applicable.
References
Supplementary materials
Supplementary Data
This web only file has been produced by the BMJ Publishing Group from an electronic file supplied by the author(s) and has not been edited for content.
Footnotes
Handling editor Richard Body
Twitter @AshleyMatthies, @michael_trauer
Contributors All four authors contributed significantly to the design of the study and manuscript preparation. Three authors performed the literature searches, selected studies and extracted data (AM, MT, RDJ). Two authors completed the meta-analysis (AM, KC). AM is the guarantor of the study.
Funding The authors have not declared a specific grant for this research from any funding agency in the public, commercial or not-for-profit sectors.
Competing interests None declared.
Patient and public involvement Patients and/or the public were not involved in the design, or conduct, or reporting, or dissemination plans of this research.
Provenance and peer review Not commissioned; externally peer reviewed.
Supplemental material This content has been supplied by the author(s). It has not been vetted by BMJ Publishing Group Limited (BMJ) and may not have been peer-reviewed. Any opinions or recommendations discussed are solely those of the author(s) and are not endorsed by BMJ. BMJ disclaims all liability and responsibility arising from any reliance placed on the content. Where the content includes any translated material, BMJ does not warrant the accuracy and reliability of the translations (including but not limited to local regulations, clinical guidelines, terminology, drug names and drug dosages), and is not responsible for any error and/or omissions arising from translation and adaptation or otherwise.