Article Text

Abstract
Objectives: To identify correlates of alcohol related assault injury in the city centre of a European capital city, with particular reference to emergency department (ED) and police interventions, and number and capacity of licensed premises.
Methods: Assaults resulting in ED treatment were studied using a longitudinal controlled intervention, a three stage design during a three year period of rapid expansion in the night-time economy, when ED initiated targeted police interventions were delivered. A controlled ED intervention targeted at high risk night-clubs was carried out. Main outcome measure was ED treatment after assault in licensed premises and the street.
Results: Targeted police intervention was associated with substantial reductions in assaults in licensed premises but unexpected increases in street assault were also observed (34% overall: 105% in the principal entertainment thoroughfare). Combined police/ED intervention was associated with a significantly greater reduction compared with police intervention alone (OR = 0.61, 95% CI 0.40 to 0.91). Street assault correlated significantly with numbers and capacity of premises. Risk of assault was 50% greater in and around licensed premises in the city centre compared with those in the suburbs, although dispersion of violence to more licensed premises was not observed.
Conclusions: Marked decreases in licensed premises assaults resulting from targeted policing were enhanced by the intervention of ED and maxillofacial consultants. Capacity of licensed premises was a major predictor of assaults in the city centre street in which they are clustered. City centre assault injury prevention can be achieved through police/ED interventions targeted at high risk licensed premises, which should also target the streets around which these premises are clustered.
- assault
- alcohol
- targeted policing
- emergency department
Statistics from Altmetric.com
Violence and disorder is concentrated in relatively small city centre entertainment areas,1 occurring most frequently in and around pubs and clubs on weekend nights.2 It involves large numbers of young adults, typically men, nearly all of whom have consumed alcohol.2–4 It is a major public health concern5,6 involving both the offenders and the injured.4,7 Although alcohol related violence has always been a problem in urban societies, in the past two decades in the UK, there has been a substantial investment by the entertainment and alcohol industries resulting in greatly increased numbers, capacity, and popularity of entertainment district bars and nightclubs.
Large numbers of alcohol related assaults that result in treatment in emergency departments (EDs) are not reported to, or recorded by, the police.8 Thus EDs have an important role to play in surveillance and sharing information,9–11 particularly in identifying and auditing hotspot licensed premises and the streets around which these are clustered. ED personnel also have the potential, based on this knowledge, to do more than just collect information—for example, to advocate and lead assault reduction initiatives in collaboration with the police and local authorities.
Here, we present the principal results of a three year study on the effects of ED and police interventions on alcohol related assaults resulting in treatment in a European capital city’s only ED. The hypothesis was that, prompted and informed by ED data, police interventions would result in a reduction in the number of assaults. A further hypothesis was that ED practitioners could enhance police interventions by challenging licensed premises managers with ED injury data and the prospect of publication in local media.
METHODS
The Home Office funded Targeting Alcohol-related Street Crime (TASC) project,12 which was prompted by ED data and concerns, focused on all incidents of alcohol related violence within a limited area of the City of Cardiff defined by police sectors: Cardiff city centre and Cardiff Bay (police sectors 29/30: the intervention area). Suburban areas of Cardiff were not subject to TASC intervention and made up the control area. Assault injury data were first disclosed to the TASC project on a monthly basis (in arrears) in January 2000. Data collected during the nine month period from April 1999 to December 1999 was disclosed as baseline information: the period when the system of ED data disclosure to the police was developed and refined. This has been described previously.9
Study design
We evaluated a longitudinal controlled intervention delivered in three stages. Assaults occurring in licensed premises were compared over three nine month periods: April–December 1999 (preintervention period), April–December 2000 (intervention period I) and April–December 2001 (intervention period II). During intervention period I the TASC interventions were developed and refined, hence two separate intervention periods.
Definitions
“Alcohol related”, as defined by the TASC project,13 were violent and disorderly incidents involving city centre drinkers. From the perspective of the University Hospital of Wales ED, alcohol related was defined as assaults reported by assault patients themselves, to have occurred inside or associated with licensed premises; alcohol consumption was not verified through blood alcohol levels. Assault was as defined by the patient and not by Home Office classifications or other published definition. Although it is acknowledged that some assault victims, and/or assailants may not have been drinking, the purpose of our study was to determine the impact in terms of assault injury ED attendances associated with the night-time licensed economy, and thus it was considered appropriate to define “alcohol related” in terms of assault location.
Study population
The ED has an estimated local coverage of 600 000 people (local NHS trust statistics). At the 2001 census Cardiff had a total population of 305 340 (145 771 males; 159 569 females). However, where the night-time economy is concerned city population estimates have limited usefulness because of inward migration from outlying areas: according to TASC data only 1869 of those arrested for (67%) and 1160 of victims of (52%) alcohol related violence and disorder came from the Cardiff area.12
Data collection
ED reception staff, prompted by software (see references 9, 10), routinely obtained precise assault locations (named licensed premises and streets). Previous work13 has established high specificity and sensitivity in terms of the validity of reports by trauma patients of injury sustained in assaults and accidents. As alcohol is not consumed in off-licensed premises, and these were not found to be a focus of violence, they were not included in the study. Similarly, assaults in other locations were identified but not studied in this project. Locations were then categorised as either pub/club or street.
Estimation of licensed premise capacity
Because licensed premises vary in capacity and the assault rate may vary according to capacity, it was necessary to identify appropriate denominators. Capacity was identified as the most appropriate surrogate measure of attendance. Capacity data were obtained from the police licensing committee record of public entertainment licences (PELs), the TASC group, the County Fire Service, Cardiff Marketing, and local newspapers. Since no formal database of capacity existed, a method based on the size of a licensed premise was developed to estimate the capacity of licensed premises for which no data were available: 65 of a total 172 premises* (38%) in the intervention area; 170/237* (72%) in the control area. Premises with known capacity were grouped according to size, typically: very small (capacity <100), small (capacity 101–300), medium (capacity 301–500), large (capacity 501–900), and extra large (capacity 901–2000). Premises with unknown capacity were categorised accordingly, and assigned the median capacity for the group.
Number of licensed premises
The city magistrates and the Police Licensing Committee hold records of the number and type of Cardiff licensed premises. We used these data, along with the Police Licensing Committee’s ledger based logs of the various licenses (current and expired) to calculate the actual number of on-licenses in the intervention and control areas.
Street assaults
Assaults within the boundaries of the intervention and control areas or on a named street located within these areas were also identified from ED data. Those streets in close proximity to licensed premises and the location of at least 10 assaults per annum in the intervention area were further analysed. Our intention was to determine the numbers of assault injury events that occurred outside, but in close proximity, to licensed premises. As it was not possible to determine the “capacity” of a street, and the study was concerned with numbers of patrons in and around licensed premises, street assaults were correlated with capacity of the licensed premises along that particular street. The hypothesis was that because licensed premises are concentrated in some streets, numbers of street assaults might be related to licensed premise capacity. However, this is unlikely in the suburbs, limiting the usefulness of this comparison outside the principal entertainment districts.
Box 1 Description of low and high level police interventions
Low level police intervention
-
Contact established with licensed premise management by TASC project manager—regular telephone calls
-
Licensed premise managers given outline/reminder of TASC project objectives
-
Regular monitoring of venue
-
Training of designated TASC door staff officers briefed to visit premises. Arrangements made for information on door staff to be regularly checked against Licensed Premise Supervisor Register
-
Ongoing visits by local community constable (as deemed necessary)
High level police intervention (performed in addition to low level measures)
-
Redeployment of local sector police to an unauthorised fast food outlet at the premises car park
-
Traffic management plan of site instituted to assist in conveyance of patrons away from site on closure
-
Proactive CCTV instruction from TASC inspector to police camera room
-
One-day covert operation—10 officers, a traffic vehicle, and a drugs dog*, in conjunction with premises door staff. Those entering the club were searched, and the dog patrolled the entry queue. Plain clothes officers followed those avoiding search to their cars. Traffic police caught those attempting to drive away
-
Eight week high profile, high visibility policing programme along two roads identified as trouble hotspots for patrons through ED and police data
-
New car park configuration and access arrangements around venue agreed with the site owners and implemented
ED intervention
As part of the TASC project, all licensed premises in the city centre and bay area were subject to police intervention (defined here as low level—see box 1). Two high risk licensed premises were selected for ED intervention on the basis of assault numbers and availability of appropriate control premises (see below). Two consultants (ED and maxillofacial) visited these premises and presented in graphic detail the injuries sustained, treatment, and numbers of assaults there to premises managers. They also informed the managers that the ED was auditing violence in their premises and that a report would be published six months later and disclosed to the local media.
One premises (club 1) experienced 71 assaults resulting in ED treatment over 12 months in 1999–2000 and was subject to ED and high level police intervention. In 2000–01, a second premises (club 2) was the location of 27 assaults over six months and was subject to ED and low level police intervention (see box 1). The effect of these interventions was evaluated by comparing numbers of assault related ED attendances before and after NHS intervention, and in relation to the sequence of all interventions and with numbers at hotspot venues not subject to ED intervention. “Hotspot” venues were defined as premises with greater than 10 incidents resulting in ED treatment per annum.
Analysis
Changes in numbers of assaults were expressed as percentages and assault rates per venue and in relation to licensed premise capacity calculated. For the ED intervention, event ratios for the change in number of assault victims attending the ED before and after intervention were calculated. For the first venue numbers of events in nine other clubs which were not subject to intervention were monitored and data pooled to provide an overall event ratio. For the second venue, data from seven other clubs were pooled (to exclude club 1 that had previously received intervention). Odds ratios for the ED interventions were calculated and combined and a Mantel–Haenszel method used to obtain a pooled odds ratio. Linear regression and χ2 hypothesis tests were applied where appropriate.
RESULTS
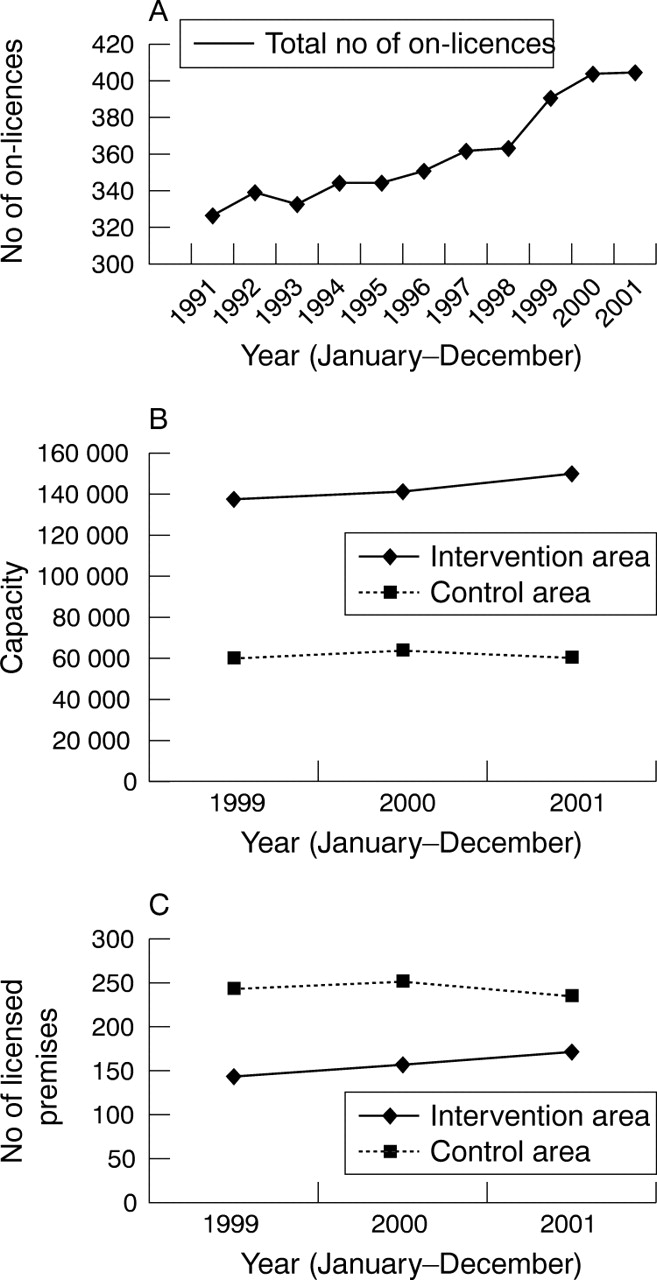
During the study period there was a gradual increase in the capacity of on-licensed premises in Cardiff County from 196 000 (327 premises) in December 1999 to 208 000 in December 2001 (405 premises: fig 1). In the intervention area the number of licensed premises increased from 142 (capacity 137 000) in December 1999 to 170 (capacity 150 000) in December 2001. In contrast, there was an overall decrease in the number of licensed premises from 243 (capacity 59 040) to 235 (capacity 58 835) in Cardiff suburbs (control area) in the same period (fig 1).

Trends in the number and capacity of licensed premises in the City of Cardiff. (A) Total number of on-licences in the City of Cardiff (interventions and control areas). (B) Estimates of on-licensed premise capacity in the City of Cardiff. (C) Number of on-licensed premises in the City of Cardiff.
Assaults inside licensed premises and street assaults combined
Analysis of all licensed premises and street assaults in the city centre demonstrated an overall increase (24%) in the number of assault incidents during the period April 1999–December 2001. In the control area the overall number of assaults increased by 6% and increased from 1.36 to 1.38 incidents when measured/100 capacity (table 1).
Number of assault incidents associated with licensed premises in the preintervention period and the intervention periods
Assaults inside licensed premises
The total number of ED attendances remained about the same through the study period, as did the percentage of all attendances that originated in a named pub/club (table 2). However, there was an overall 12% (308 to 346) increase in the number of assaults occurring in licensed premises in the intervention area: 4% in intervention period I, and 8% in intervention period II (table 1). In comparison, the number of assaults in licensed premises in the control area decreased by 7% over the same period: an increase in intervention period I of 4% and a decrease in intervention period II of 12%. However, relative to total capacity there was no overall change in the number of assaults/100 capacity in the intervention area, but a slight decrease in the control area (table 1).
Number of assault patients presenting to the ED in the preintervention period and the intervention periods
Assault occurred in 43% of on-licensed premises during the preintervention period—a rate of 5.1 assaults/venue/9 month period. Assault occurred in 46% of venues (4.5 incidents/venue/9 month period) during intervention period I and in 41% of venues (4.8 incidents/venue/9 month period) during intervention period II. In comparison, assault occurred in 27% of licensed premises (1.6 incidents/venue/9 month period) in the control area in the preintervention and intervention period I and in 28% of licensed premises (1.5 incidents/venue/9 month period) during intervention period II. Therefore, dispersion of violence to more licensed premises was not observed either in intervention or control areas.
Street assaults
Assaults in intervention area streets increased from 360 during the preintervention period to 483 during intervention period II, an increase of 34%. In comparison, assaults in control area streets increased by only 8% overall (table 1). One city centre street (St Mary Street) accounted for between 18% and 30% of all street assaults over two consecutive 12 month periods; a disproportionate increase compared with other streets. Assaults in this street increased by 105% from 66 to 135 between preintervention and intervention period II; y = 35x + 30.1, R2 = 1, p<0.01. Both the number and capacity of licensed premises (on-licenses) on St Mary Street increased significantly (y = 2675x + 4876, R2 = 1, p<0.01), and capacity was positively correlated with number of street assaults (y = 3.5064x + 63.823, R2 = 0.41). The number of street assaults/100 capacity increased from 0.8 to 1.02 during the overall intervention period.
ED intervention
Following ED and high profile police intervention there was a 54% reduction in the number of assaults occurring in club 1 (table 3). In nine other high risk licensed premises violence hotspots event ratios ranged from 0.31 (a 69% decrease) to 1.73 (a 73% increase) with an overall event ratio of 0.78 (95% CI 0.63 to 0.96). This demonstrated a significant reduction in these licensed premises violence overall, ranging from 22% to 67% (table 3) in particular premises. The odds ratio, expressing the change at club 1 relative to that at nine control venues, of 0.60 (95% CI 0.37 to 0.97) represented a significantly greater improvement than in the other clubs combined. Following the interventions at club 2 the number of assaults also decreased albeit not significantly (event ratio 0.56; 95% CI 0.30 to 1.03; table 4). The corresponding event ratio for the remaining seven clubs was 0.89, giving an odds ratio of 0.62 (95% CI 0.29 to 1.32). Note the number of control venues is reduced due to exclusion of club 1, which had already received the intervention, and a shorter counting period resulting in fewer events.
ED intervention at club 1. Comparison of assaults in club 1 before and after ED intervention and with nine other “hotspot” venues
ED intervention at club 2. Comparison of assaults in club 2 before and after ED intervention and with seven other “hotspot” venues
Combining the two odds ratio estimates from interventions at clubs 1 and 2 gave a pooled odds ratio of 0.61 (95% CI 0.40 to 0.91, χ2 = 6.00, df = 1, p = 0.014), indicating that the ED intervention, overall, was associated with significantly greater assault reduction compared with that achieved through police intervention alone.
Both intervention clubs had been opened more recently than comparison clubs. Club 1 was located away from other clubs and the main entertainment thoroughfare whereas club 2 was among other clubs along St Mary Street. Both were categorised as extra large in terms of capacity (tables 3 and 4).
DISCUSSION
The results of this study show that against a backdrop of increased licensed premises capacity, targeted police work in a city centre, prompted by ED assault data resulted in significant reduction in violence in high risk premises. Jeffs and Saunders14 also found that proactive policing significantly reduced the number of arrests for crimes related to alcohol and reduced assault injuries presented to the ED.15 A principal finding of this study is that visits to high risk premises by prevention orientated hospital consultants armed with illustrated injury data can have a significant effect on numbers of assaults, particularly when this is integrated with police activity. The knowledge that the ED was auditing violence inside their premises and that the results would be published was a particularly powerful incentive for licensees. Overall, this additive effect supports the current crime prevention policy which focuses on agencies working together in crime and disorder reduction partnerships.
Although, overall, the actual number of assaults in licensed premises increased by 12% during the intervention period, when capacity was taken into account, there was no overall change. This suggests prevention of an increase in licensed premises violence overall. However, conversely, the number of street assaults, particularly on the principal city entertainment thoroughfare (see below), increased substantially during the same period. Thus, it appears that violence may have been displaced onto the street or that street violence prevention effort was underemphasised. Either way, these fndings show that licensed premises interventions can be effective but must be combined with robust measures to reduce street violence.
Importantly, however, police and ED activity did not result in displacement of assaults from a targeted licensed premise to other licensed premises, either in the intervention area or to the suburbs. Overall changes in the incidence of assault in intervention and control areas could not be explained by displacement. One explanation is that most alcohol related violence is not planned but, reflecting situational and intoxication factors, tends to erupt spontaneously. For example, violence outside venues is associated with large numbers of intoxicated people congregating and competing for limited food and transport facilities.16 This suggests that an increased number of premises do not, per se, lead to more violence, rather it is the concentration of these premises in close proximity to each other and the presence of high risk premises that leads to problems. Thus, effort targeted against particular high risk premises and preventing over-concentration should be principal objectives.
Other studies have also shown that geographical areas with many outlets tend to have higher rates of violence than areas with fewer outlets and that there is a significant relationship between outlet number and violence rates.17–20 However, in this study, relative to capacity, the number of assaults in the intervention area licensed premises remained constant, which adds further support to the hypothesis that the major predictor of violent incidents is the proximity of premises to each other. This study also provides evidence that licensed premises in the suburbs are significantly safer than city centre premises and that the expansion in the UK night-time economy is characterised by migration of drinkers from the suburbs to the city centre.
The 34% overall increase in street assaults correlated significantly with increases in overall total capacity and reflected a 105% increase in assaults on one street. Licensed premises managers have little or no responsibility for street safety, except in relation to their statutory obligation not to serve intoxicated individuals, and to ensure that door staff behave responsibly. Furthermore, other intervention studies have shown that bar owners, managers and staff usually do not volunteer to change, do not cooperate fully with, or change appreciably as a result of interventions or sustain changes after intervention (see reference 21). Thus, proactive policing must extend to areas around licensed premises as well as inside, and be continuous.
Against the backdrop of a dramatic increase in violence in one street is one cause for optimism. This relates to the concentration of disorder in one particular street and lack of evidence of violence displacement. Clearly, if this could be prevented, then there would be a dramatic effect on overall levels of violence in the city. This also seems likely in other towns and cities, if a major lesson of this study is learned, namely that efforts to control licensed premises violence must be combined with effective interventions to combat street violence, based on accurate, continuously updated information from police and EDs.
Limitations
Although types and severity of injury were not studied they may have changed as a result of interventions. The rationale for this project was that easily obtainable anonymised ED assault injury data could be shared with other agencies to inform and prompt violence prevention initiatives, which in turn should reduce the number of assault patients, which proved to be the case. It would be over burdensome on the NHS to expect such a database to include details on patient outcome but, regardless of injury severity, assault patients utilise time and resources in a busy ED, which could be redirected.
No database or accurate record of total licensed premise capacity exists, probably because not all premises are required, under the terms of their licence, to limit capacity. The method used for estimating capacity was based on the approximate size of premises and consistent with the method used by the fire service. Only premises that require a PEL, typically bars that close after 11 pm, have a capacity limit. We acknowledge that estimates provided by the fire service are only guides and do not represent actual capacity. However, on the basis of this study, capacity data should be available as small area capacity is a major predictor of street violence.
This study was not concerned with reducing assaults relative to capacity or location, hence selection of clubs 1 and 2 based on high numbers of assaults was considered appropriate, and this was not a source of bias for the study aims.
Comment
This paper coincides with current debate over the implementation, in 2005, of new licensing laws for England and Wales (Licensing Act 2003) which will enable pub/club managers to apply for variation in licensing hours and will give more powers to local authorities and the police to deal with problem premises. There is evidence that longer opening hours overall will result in more alcohol related problems, over a longer period, but that varying closing times will reduce the numbers of intoxicated people leaving premises simultaneously and thus reduce opportunities for violence.22 The study reported here while not concerned with these issues directly, demonstrate that EDs and the police, working together, can prevent violence.
Acknowledgments
Dr RG Newcombe (Department of Epidemiology, Statistics and Public Health, University of Wales College of Medicine) provided statistical advice and some analyses.
CONTRIBUTORS AL Warburton was the principal researcher and JP Shepherd conceived and supervised the project and chaired the project management group. Both authors jointly designed the project protocol and drafted and edited the manuscript.
REFERENCES
Footnotes
-
↵* Note the total number of premises refers to all premises that were included in the study during the study period. They may differ from numbers reported during the individual study periods.
-
↵* Police assumed that illicit drug carrying patrons would contribute disproportionately to violence.
-
Wales Office of Research and Development (WORD) grant no. R/98/037.
-
Competing interests: none declared