Article Text

Abstract
Abstract: To demonstrate trends in trauma care in England and Wales from 1989 to 2000.
Study population: Database of the Trauma Audit and Research Network that includes hospital patients admitted for three days or more, those who died, were transferred or admitted to an intensive care or high dependency area.
Method: To demonstrate trends in outcome, severity adjusted odds of death per year of admission to hospital were calculated for all hospitals (n=99) and 20 hospitals who had participated since 1989 (adjustments are for Injury Severity Score, age, and Revised Trauma Score). The grade of doctor initially seeing the injured patient in accident and emergency and median prehospital times per year of admission were calculated to demonstrate trends in the process of care. Trend analyses were carried out using simple linear regression (odds ratio versus year).
Results: The analysis shows a significant reduction in the severity adjusted odds of death of 3% per year over the 1989–2000 time period (p=0.001). During the period 1989–1994 the odds of death declined most steeply (on average 6% per year p=0.004). Between 1994 to 2000 no significant change occurred (p=0.35). This pattern was mirrored by the 20 permanent members where the odds of death also declined more steeply over the 1989–1994 period. The percentage of severely injured patients (ISS >15) seen by a consultant increased from 29 to 40 from 1989–1994 but has remained static subsequently. Median prehospital times for severely injured patients have not changed significantly since 1994 (51 to 45 minutes).
Conclusion: Most of the case fatality reduction for trauma patients reaching hospital over the 1989–2000 time period occurred before 1995 when there was most marked change in the initial care of severely injured patients.
- trauma care
Statistics from Altmetric.com
Studies from both sides of the Atlantic suggested that post-injury care by health services made an important contribution to reducing case fatality after injury at the end of the past century.1–3 Changes that occurred in North America were different from those that occurred in England and Wales; a common feature however being that changes tackled perceived trauma system deficiencies rather than the implementation of evidence based medicine. In the United States important system changes occurred in the prehospital environment where paramedics were authorised to triage patients to levels 1, 2, and 3 of trauma care according to the apparent physiological derangement of a patient and mechanism of injury; their previous preventable death audits had suggested that the wrong patients were being brought to the wrong hospital.3,4 Within the UK in 1988 the greatest system problem seemed to be lack of seniority and expertise of those treating severely injured patients within the emergency department.5 Our last published analysis showed changes in the outcome and process of care in England and Wales between 1989 and 1997.1 It indicated that the severity adjusted odds of death declined on average by 40% in hospitals participating in the Trauma Audit and Research Network, (60% in hospitals who participated since 1989), together with a doubling of the frequency in which consultants were involved in the most seriously injured cases We did not attempt to draw a cause and effect link at the individual patient level between these observations. Within this current analysis of hospitals participating in the Trauma Audit and Research Network we wished to determine if outcome had continued to improve up until the year 2000 and whether or not senior doctors were continuing to get involved more frequently in the care of those most severely injured. We also focused on prehospital times for patients with mild/moderate versus severe injury.
METHODS
A total of 129 979 patients injured by non-thermal blunt trauma between 1989 and 2000, and treated by participating hospitals in the Trauma Audit and Research Network (TARN) were studied. Patients included those of any age who sustained injury resulting in immediate admission to hospital for three days or longer, admission to intensive care or high dependency unit, transfer between hospitals for more specialist care, or death. Patients over 65 years with isolated fracture of the femoral neck or pubic ramus and those with single uncomplicated limb injuries are excluded. Hospitals complete a single data entry sheet on each patient. Staff within these hospitals are trained by the coordinating centre in Salford. The data sheet requests information on the post coded location of the incident and the patient's residence as well as details of the circumstances of the incident (for example, fall, assault, type of road traffic crash, and treatment on route to hospital). Glasgow Coma Scale, blood pressure, and respiratory rate are recorded when the patient enters the emergency department so that the revised trauma score (RTS-measure of physiological derangement6) can be calculated. Information is obtained about procedures carried out in the emergency department, their timing, seniority of doctors involved, and the time of transfer to theatre, ward, or intensive care. Brief details of any operations and complications are recorded. Every injury is recorded and defined according to the Abbreviated Injury Scale dictionary.7 This is used by trained coders at the TARN coordination centre (University of Manchester) and enables calculation of the injury severity score (ISS),8 patient's age is also recorded and outcome in terms of survival or death is based on assessment at discharge or 93 days whichever is first.9
Statistical analysis
A logistic regression model was used to calculate the 95% confidence intervals for the odds of death in each year (1990–2000), compared with the 1989 baseline. The effect of year attendance on odds of death after injury was adjusted for variations in the anatomical severity of injury (ISS) physiological derangement (RTS), and age of patients. These factors were entered as independent variables in the model. ISS and RTS were entered as continuous variables and age as a categorical variable (five bands; <55 years, 55–64 years, 65–74 years, 75–84 years, and >84 years). Initially only 83 929 patients with complete physiological data were studied. The remaining patients had absent physiological data either because they were only transferred in to trauma network hospitals, thus having no initial A&E physiological data, or because there had been failure to record (usually) the respiratory rate in the initial hospital. These patients were included in a repetition of this analysis by allocating a median (dummy) RTS identical to that of patients with a similar ISS and known physiology.1 Linear regression was used to seek a yearly trend in the odds of death. A subgroup analysis was carried out in 20 participating hospitals who have been continuous members since 1989. This model was used to generate Ws scores (observed versus expected number of survivors per 100 patients adjusted for national case mix10) for patients seen by different seniorities of doctor, and for each hospital over the time period 1996–2000.
RESULTS
Process of care
Table 1 gives the demographic and injury severity breakdown of 109 225 patients who are included through ambulance arrival at the first hospital (that is, not self presenting or included after transfer). This indicates that over two thirds of patients meeting the inclusion criteria had a moderate (ISS 9–15) or severe (ISS >15) injuries, 6.2% (6476 of 109 225) of those arriving at hospital alive do not subsequently survive. The age distributions that are skewed to the right (a younger population) have medians in the early 40s with a preponderance of men in both groups. Two thirds of patients had missing prehospital times but had similar characteristics to those for whom times have been recorded, with a bias towards those more severely injured having recorded times. Figure 1 shows that median times for more severely injured patients increased from 35 to 51 minutes between 1989–1994 with a reduction to 45 minutes in the year 2000. For the less severely injured times also increased from 39 minutes to 48 minutes (89–94) with a reduction to 44 minutes in 2000.
Injury and demographic data on patients submitted by first receiving hospital (and recording of prehospital times)
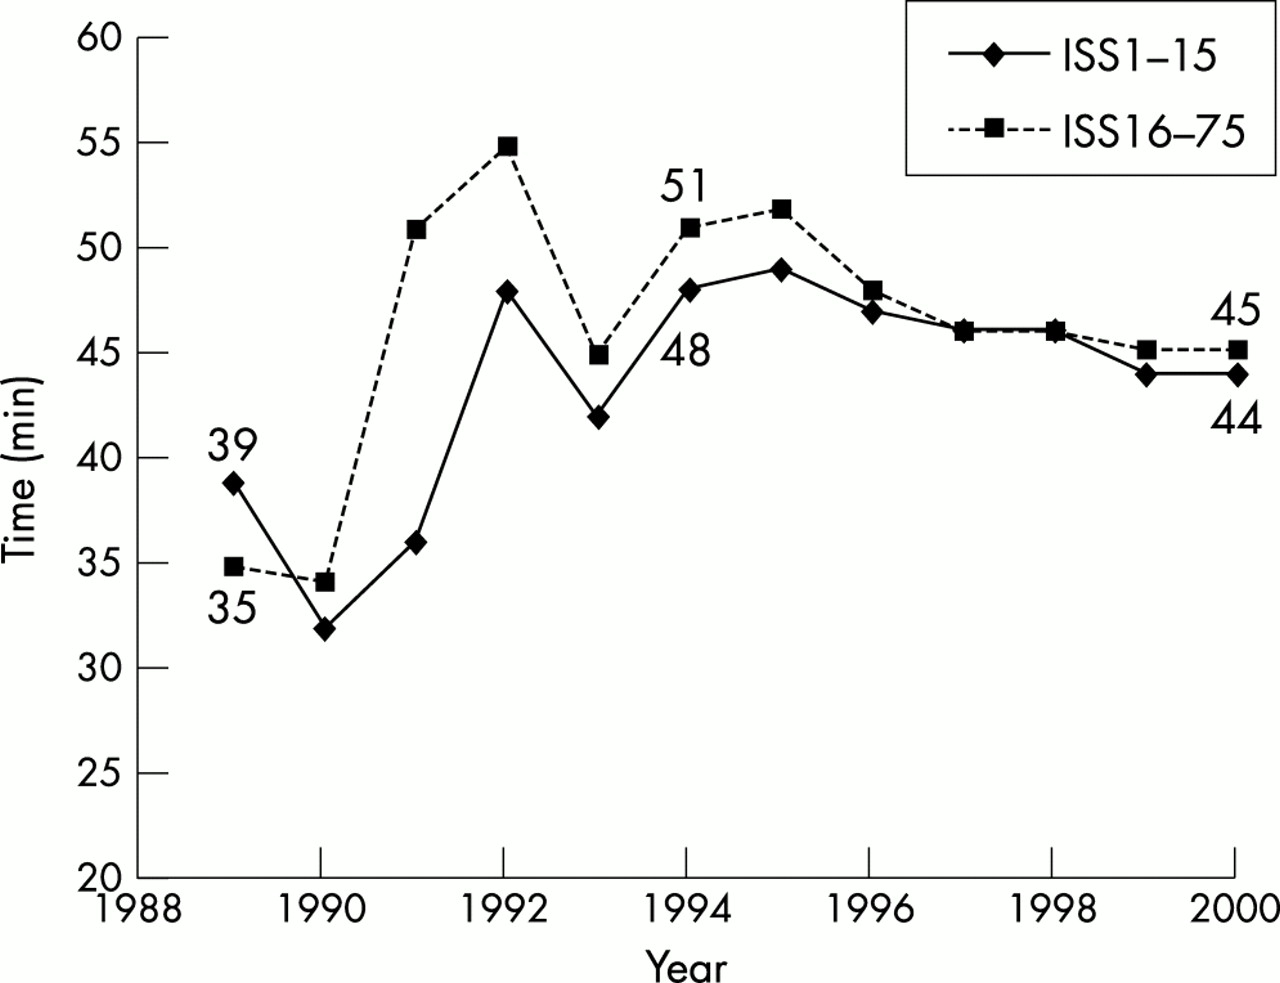
Prehospital times by year of injury.
The grade and speciality of each doctor seeing the patient in A&E is complete in all but 4484 (4%) of patients entered through the first receiving hospital. For this group the age and injury severity breakdown is identical to that where grade is recorded (table on journal web site). Figure 2 shows that for more severely injured patients (ISS>15) consultants were involved on 40% of occasions in 1994 as compared with 25% of occasions in 1989. This level of involvement persisted after 1994 (39% of cases involved a consultant as most senior doctor in the year 2000). Middle grades were most senior in 46% of severely injured cases in 1989 and 45% of cases in 2000 with an interim reduction to 33% of cases in 1994. Senior house Officers (SHOs) were most senior in 29% of cases where severe injury was present in 1989 and were still most senior in 15% of cases in the year 2000. Consultant involvement has remained fairly static in patients with mild and moderate injury, which make up most of the database (7% in 1989 and 10% in 2000). Middle grade involvement increased markedly in these patients from 1996 onwards (becoming most senior doctor in 35% of cases in 2000 compared to 19% in 1996). Consequently SHOs were most senior less frequently (55% of these cases in the year 2000 versus 77% in 1989). Consultants when involved arrived within 30 minutes of the patient in 80% (10 100/12410) of occasions, hence the analysis focused on most senior rather than grade of first doctor seeing the patient in A&E.
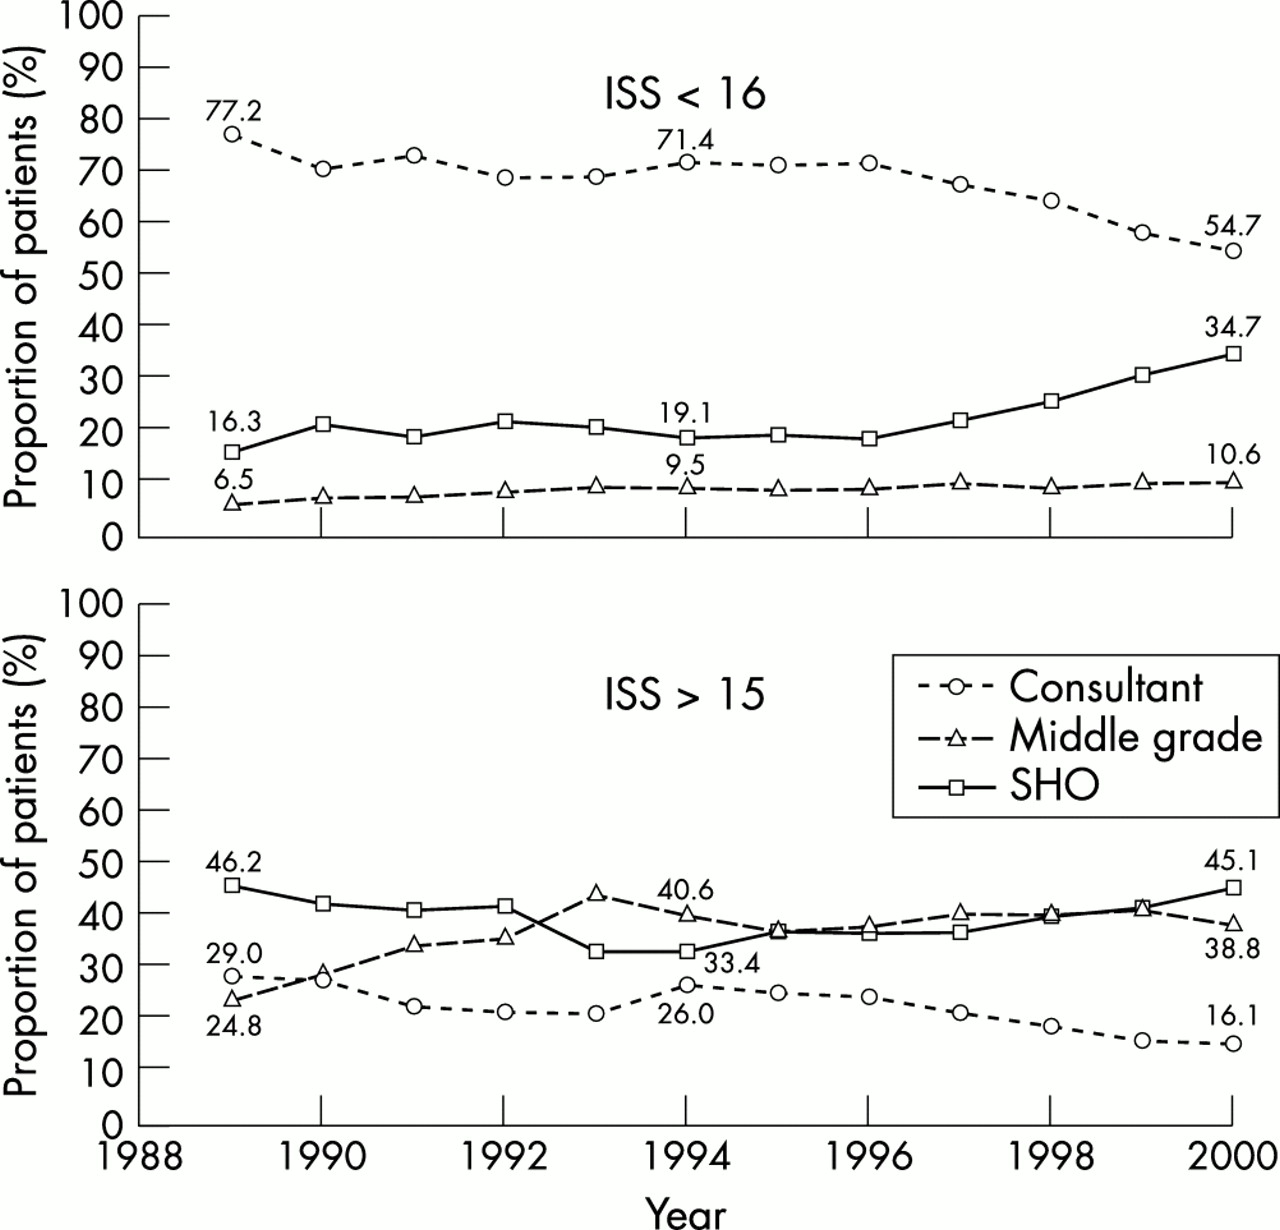
Grade of most senior doctors by year.
In 20 continuous members of TARN trends in most senior doctor seeing the patient in A&E were identical to those displayed in figure 2 (graphs on journal web site).
Outcome
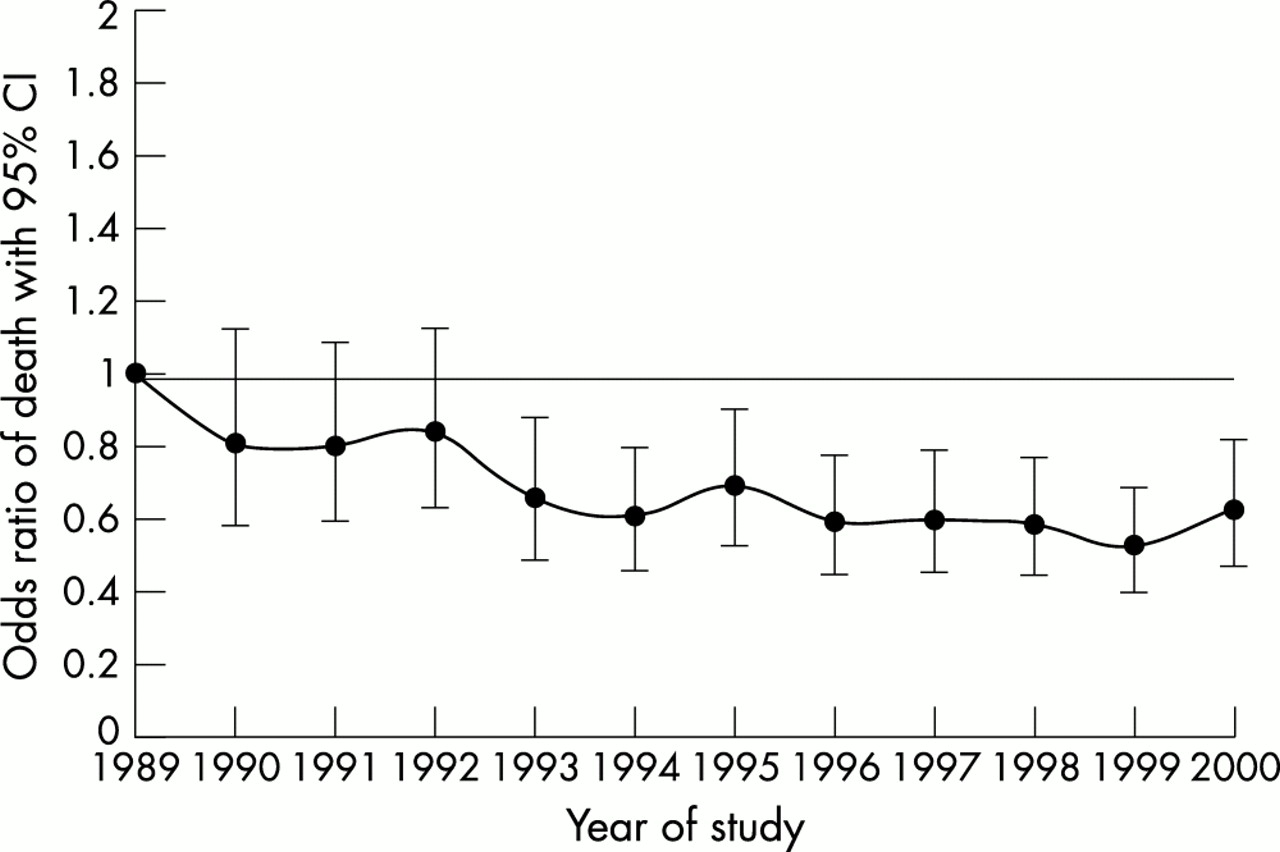
Figure 3 shows that severity adjusted odds declined significantly between 1989 to 1994 (a decline of 6% per year p=0.004) with no significant change between 1994 and the year 2000 (p=0.35). This result was not changed by the inclusion of an additional 45 000 who had a dummy RTS allocated to them or by analysing the subset of 20 participating hospitals (figures available on web site). Figure 4 shows that there were significant variations in outcome according to the Ws score between hospitals in the more recent quintennium. It is notable that the top 10% hospitals deliver an extra 4.5% of trauma survivors having a Ws score of +1.5 (upper band on fig 4) compared with a Ws score of −3 (lower band fig 4) for the bottom 10% of hospitals, a statistically significant mortality difference. This equates to a standardised mortality ratio difference of 85 between the top and bottom 10% of hospitals given that only 6% of patients on the database actually die from their injuries. Figure 5 shows no “observed versus expected” survival difference between patients who are treated in A&E by different seniorities of clinician.

Odds ratio of death adjusted for ISS90 RTS and age (all hospitals) n=83 929.
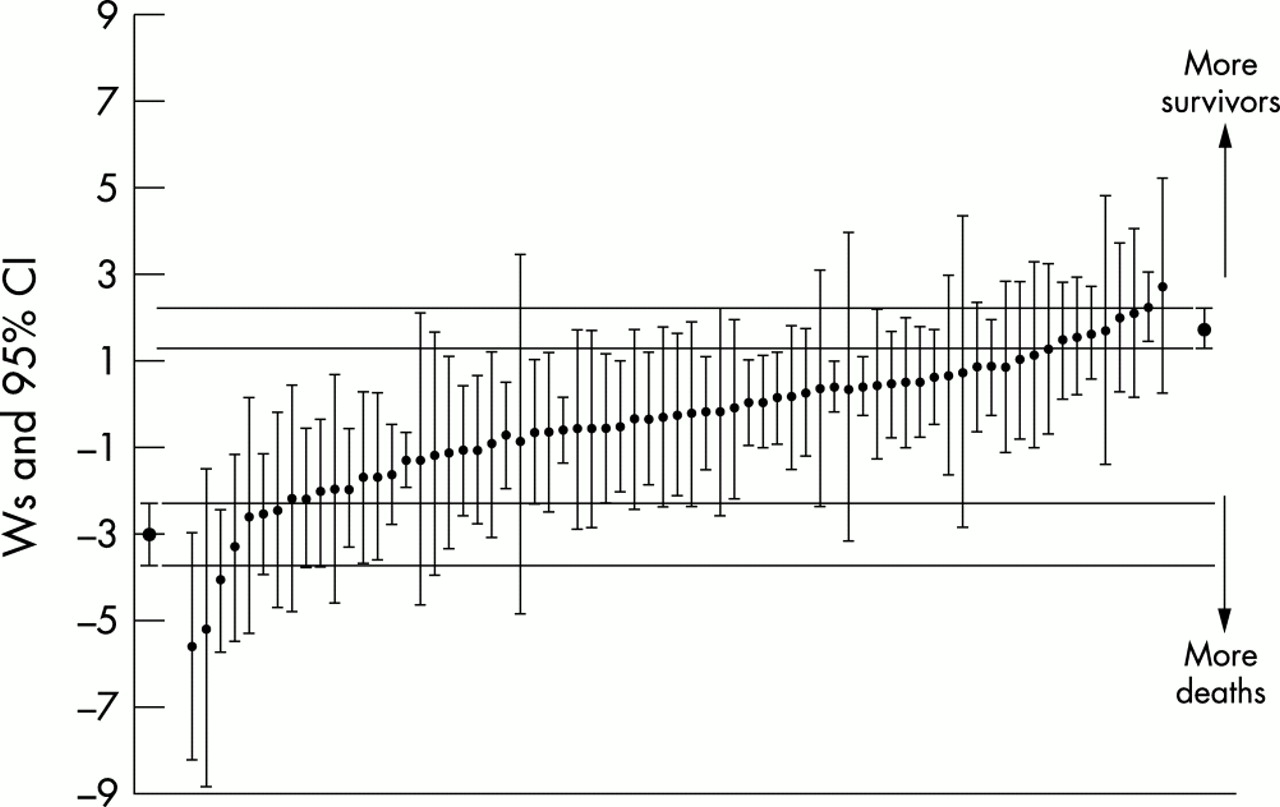
Hospital Ws scores 1996–2000 (number of observed versus expected survivors per 100 trauma patients standardised for the database casemix) n=58 672.

Ws scores by most senior doctor who managed the patient.
DISCUSSION
Our analysis suggests that trauma outcome improved significantly in England and Wales in TARN participating hospitals between 1989 and 1994. Over this time period there were clinically significant changes in care particularly in the proportion of severely injured patients seen by a consultant, which increased from 25% to 40%. Over the same time period these severely injured patients took on average 16 minutes longer to get to hospital than in 1989. Through 1994 and the year 2000 there has been no change in the severity adjusted odds of death, which seems to parallel a static level of consultant involvement and little change in prehospital times, although there continues to be significant variation in outcome between hospitals. The analysis we have performed has not shown benefit for individual patients by increasing the seniority of doctor in acccident and emergency who sees them. One potential explanation for this is that increased consultant involvement is not just beneficial for the patients whom the consultant sees but also beneficial for the whole hospital trauma system, thus conferring benefit on patients in centres where consultant involvement is frequent but not ubiquitous. This could explain the positive senior clinician/improved outcome associations at group level and the lack of association at individual patient level. Indeed Scottish trauma audit suggests improved outcome in hospitals with higher consultant involvement A&E (personal communication, A Gray). There are other explanations for the observed trends in particular the promulgation of Advance Trauma Life Support (ATLS) training in the early 1990s, which has become more standard since. However, our data on ATLS status of clinicians treating patients is too limited for meaningful analysis.
The weaknesses, as always with analyses of this sort, relate to data quality and representativeness. It is not possible for us to state categorically that all eligible cases, in particular all deaths have been submitted by participating hospitals. However, as hospitals support their own data collection, have to pay the TARN coordinating centre to receive data analysis, and are trained in how to acquire data, it seems reasonable to assume that the motivation for belonging to the network must be altruistic. We also provide guidance on the approximate annual number of cases expected from each hospital according to A&E new patient attendances (derived from the database). Most essential data are complete within the cases submitted, but respiratory rate is not recorded in 30% of cases. Respiratory rate has the lowest weighting of all predictive variables used (6.9). We believe we have used a reasonable technique for taking account of missing respiratory rate, which shows that our results do not change when patients' missing physiology are included. The analysis is unlikely to suffer from lack of representativenes as current TARN membership includes more than 50% of trauma receiving hospitals in England and Wales and trends in process and outcome shown in this analysis are mirrored by trends in 20 hospitals, which have been TARN members consistently since 1989. The technique for determining the effectiveness of consultant compared with more junior doctor intervention can however be criticised. In general it is accepted that randomised control trials are the standard for measuring the efficacy of treatment but this is not practical for studying the effects of clinician seniority. However, with mortality rates at 6% it may be that even this large dataset lacks power to show the effect of consultant involvement using case mix adjustment. It may be more appropriate to look at specific injuries with higher severity where the event rate (mortality) is higher; or to use a case-control approach that has been used in a North American dataset.11 We intend in the near future to move from mortality to disability based outcome that is likely to improve the ability of the database to observe the effect of trauma interventions.
We believe this is the most current analysis of trends in trauma outcome internationally. From the literature it is uncertain whether trauma outcome in terms of case mix has remained static since the mid-1990s in other countries. Analysis before this paralleled that in the UK and suggested that significant improvement had occurred with changes in trauma systems up until this time point.12,13
In conclusion, in England and Wales the reduced case mix fatality trend in trauma patients reaching hospital alive seems to have ended in the mid-1990s, the time at which the level of consultant involvement in severely injured cases plateaued. Despite these group associations the benefit of consultant involvement at the individual patient level has yet to be shown using our large observational database. Future research aiming to improve the evidence base of trauma care should take account of trends in trauma outcome, and consider carefully if and how observational databases can be utilised to study the effectiveness of trauma interventions.
Contributors
Addenbrooke's Hospital, Airedale General Hospital, Arrowe Park Hospital, Ashford General Hospital, Atkinson Morley's Hospital, Barnsley District General Hospital, Basildon Hospital, Bassetlaw Hospital, Bedford Hospital, Birmingham Heartlands Hospital, Blackburn Royal Infirmary. Blackpool Victoria Hospital, Booth Hall Children's Hospital, Bradford Royal Infirmary, Bristol Royal Infirmary, Bromley Hospital, Broomfield Hospital, Burnley General Hospital, Calderdale Royal Hospital, Cheltenham General Hospital, Chesterfield & North Derbyshire Royal, Chorley District General Hospital, City Hospital, Birmingham, Colchester General Hospital, Conquest Hospital, Countess of Chester Hospital, County Hospital, Hereford, Coventry & Warwickshire Hospital, Craigavon Area Hospital, Cumberland Infirmary, Daisy Hill Hospital, Darrent Valley Hospital, Derbyshire Royal Infirmary, Derriford Hospital, Dewsbury District Hospital, Diana, Princess of Wales Children's Hospital, Diana, Princess of Wales Hospital, Doncaster Royal Infirmary, Ealing Hospital, Eastbourne District General Hospital, Epsom Hospital, Fairfield General Hospital, Frenchay Hospital, Friarage Hospital, Furness General Hospital, Glan Clwyd District General Hospital, Gloucestershire Royal Hospital, Grantham & District Hospital, Guy's Hospital, Hammersmith Hospital, Harrogate District Hospital, Heatherwood & Wexham Park Hospital, Hillingdon Hospital, Hinchingbrooke Hospital, Homerton Hospital, Hope Hospital, Horton General Hospital, Huddersfield Royal Infirmary, Hull Royal Infirmary, Ipswich Hospital, James Paget Hospital, Jersey General Hospital, John Coupland Hospital, John Radcliffe Hospital, Kent & Canterbury Hospital, Kent & Sussex Hospital, Kettering General Hospital, Kings College Hospital, Kings Mill Hospital, Leeds General Infirmary, Leicester Royal Infirmary, Leigh Infirmary, Leighton Hospital, Lincoln County Hospital, Louth County Hospital, Manchester Royal Infirmary, Mater Infirmorum Hospital, Medway Hospital, Middlesbrough General Hospital, Milton Keynes Hospital, Nevill Hall Hospital, Newcastle General Hospital, Norfolk & Norwich General Hospital, North Manchester General Hospital, North Staffordshire Royal Infirmary, North Tyneside General Hospital, Northampton General Hospital, Northern General Hospital, Northwick Park Hospital, Nottingham University Hospital, Ormskirk & District Hospital, Peterborough District Hospital, Pilgrim Hospital, Pinderfields General Hospital, Pontefract General Infirmary, Poole Hospital, Prince Charles Hospital, Prince Philip Hospital, Llanelli, Princess Alexandra Hospital, Princess Margaret Hospital, Queen Alexandra Hospital, Queen Elizabeth Hospital (Gateshead), Queen Elizabeth Hospital, Kings Lynn, Queen Elizabeth, Queen Mother Hospital, Regional Spinal Injuries Unit, Southport, Rochdale Infirmary, Rotherham District General Hospital, Royal Aberdeen Children's Hospital, Royal Albert Edward Infirmary, Royal Berkshire Hospital, Royal Bolton Hospital, Royal Cornwall Hospital, Royal Devon & Exeter Hospital, Royal Gwent Hospital, Royal Hallamshire Hospital, Royal Hampshire County Hospital, Royal Lancaster Infirmary, Royal Liverpool Childrens Hospital, Royal Liverpool University Hospital, Royal London Hospital, Royal Manchester Children's Hospital, Royal Oldham Hospital, Royal Preston Hospital, Royal Shrewsbury Hospital, Royal Surrey County Hospital, Royal Sussex County Hospital, Royal United Hospital, Royal Victoria Hospital, Belfast, Royal Victoria Infirmary, Newcastle, Sandwell District General Hospital, Scarborough Hospital, Scunthorpe General Hospital, Selly Oak Hospital, Sheffield Children's Hospital, Skegness & District Hospital, South Tyneside District Hospital, Southampton General Hospital, Southend Hospital, Southmead Hospital, Southport & Formby District General, St Bartholomews Hospital, St George's Hospital, St Helier Hospital, St James Hospital, St James' University Hospital, St Mary's Hospital, London, St Peters Hospital, Chertsey, St Thomas' and Guys Hospital, Stepping Hill Hospital, Stoke Mandeville Hospital, Sunderland Royal Hospital, Tameside General Hospital, Taunton & Somerset Hospital, The Princess Royal Hospital, Trafford General Hospital, University Hospital Lewisham, University Hospital of Hartlepool, University Hospital of North Tees, University Hospital of Wales, University Hospital, Aintree, Walton Centre for Neurology, Wansbeck General Hospital, Warrington Hospital, Warwick Hospital, Waterford Regional Hospital, Watford General Hospital, West Cumberland Hospital, West Middlesex University Hospital, West Wales General Hospital, Weston General Hospital, Weymouth & District Hospital, Whipps Cross Hospital, Whiston Hospital, William Harvey Hospital, Withington Hospital, Withybush General Hospital, Worcester Royal Infirmary, Worthing Hospital, Wycombe Hospital, Wythenshawe Hospital, York District Hospital.
REFERENCES
Supplementary materials
Lack of change in trauma care in England and Wales since 1994
F E Lecky, M Woodford, O Bouamra and D W Yates on behalf of the Trauma Audit Research Network
Authors' Correction
Figure 2 Grade of most senior doctors by year.
Please note that the key to figure 2 is incorrect. The correct key is shown here:The triangles indicate the Consultant line
The squares indicate the Middle grade line
The circles indicate the SHO lineThe error is much regretted
. Web-only Figures and Tables
Files in this Data Supplement:
- Figure 2a:
-
Grade of most senior doctor by year (20 core hospitals) - Figure 3a:
-
Odds ratio of death adjusted for ISS90RTS and Age (Median RTS for missing) 20 core hospitals, n=45,676 - Figure 3b:
-
Odds ratio of death adjusted for ISS90RTS and Age (20 core hospitals), n= 28,784 - Figure 3c:
-
Odds ratio of death adjusted for ISS90RTS and Age (Median RTS for missing) (All hospitals) ,n= 129,479 - Figure 5a:
-
WS scores by most senior doctor who managed the patient (missing RTS included) - Table 2:
-
Distribution of recorded grade by ISS and experience survey Age (Excluding all referrals) 1989-2000
- Figure 2a:
-
Linked Articles
- Correction