Article Text

Abstract
Objectives: To evaluate the different internal factors influencing patient flow, effectiveness, and overcrowding in the emergency department (ED), as well as the effects of ED reorganisation on these indicators.
Methods: The study compared measurements at regular intervals of three hours of patient arrivals and patient flow between two comparable periods (from 10 February to 2 March) of 1999 and 2000. In between, a structural and staff reorganisation of ED was undertaken. The main reason for each patient remaining in ED was recorded and allocated to one of four groups: (1) factors related to ED itself ; (2) factors related to ED-hospital interrelation; (3) factors related to hospital itself; and (4) factors related to neither ED nor hospital. The study measured the number of patients waiting to be seen and the waiting time to be seen as effectiveness markers, as well as the percentage of time that ED was overcrowded, as judged by numerical and functional criteria.
Results: Effectiveness of ED was closely related with some ED related and hospital related factors. After the reorganisation, patients who remained in ED because of hospital related or non-ED-non-hospital related factors decreased. ED reorganisation reduced the number of patients waiting to be seen from 5.8 to 2.5 (p<0.001) and waiting time from 87 to 24 minutes (p<0.001). Before the reorganisation, 31% and 48% of the time was considered to be overcrowded in numerical and functional terms respectively. After the reorganisation, these figures were reduced to 8% and 15% respectively (p<0.001 for both).
Conclusions: ED effectiveness and overcrowding are not only determined by external pressure, but also by internal factors. Measurement of patient flow across ED has proved useful in detecting these factors and in being used to plan an ED reorganisation.
- patient flow
- reorganisation
- ED, emergency department
- NPW, number of patients waiting
- WT, wating time
Statistics from Altmetric.com
Emergency department (ED) overcrowding is closely related to a decrease in both subjective patient satisfaction,1,2 and objective care quality.3–5 Attendance peaks have frequently been invoked as one of the major reasons for overcrowding, and the “number of arrivals per hour” has been proposed as an explanation for ED performance.6–10 However, this indicator does not take into account the effect of patients who remain in ED because of internal reasons. American studies have demonstrated that measurement of patient flow in ED might be valuable tool to analyse the influence of internal factors on overcrowding.11,12 Although similar studies have not been conducted, it is conceivable that this methodology would be practical in European countries. In this sense, in a preliminary assessment of the relative effect of external and internal factors performed in Spain, it has been demonstrated that such internal factors are at least (if not more) as important as external factors in determining ED overcrowding.13 However, the question of whether ED patient flow can actually be improved by uncovering ED internal dysfunction or modifying ED structures, has been poorly studied.14
This study was designed in two separate phases. In the first phase, the aim was to evaluate the actual performance of our ED in practice. We took care to distinguish problems in ED capacity from process problems slowing down patient flow. Based on data obtained from this phase, a thorough reorganisation of ED was carried out a few months later. In the second phase of the study, after an adequate period of adaptation, the same measurement strategies were applied to assess whether the reorganisation had improved patient flow, improved effectiveness and reduced periods of ED overcrowding.
METHODS
The Internal Medicine Unit (IMU) of our ED15,16 is divided into three different areas: waiting area, where patients wait to be seen on trolleys under the close supervision of physicians and nurses, but real assistance is not provided; initial assessment area, where the initial clinical assessment and diagnosis of patients is performed; and treatment and observation area, where patient remains until discharge or admission is decided. Patients arriving at ED are immediately seen by a triage physician who categorises them according to severity level of their complaint.
The resources of IMU, before we undertook the reorganisation, are summarised in table 1. At that time, the initial assessment area was able to attend to a maximum of five patients each hour (that is, 120 patients per day). The treatment and observation area had 25 beds, insufficient to permit immediate transfer of patients whose management in the initial asssessment area was complete.
Resources before and after ED reorganisation, and percentage of difference between periods
From 10 February to 2 March 1999, the number of patients arriving at and being located in each area of ED was regularly recorded at three hour periods. The rate of patient arrival throughout the day and rates of patient flow in the different ED areas were calculated. Additionally, the patient disposition (discharged, admitted, left without being seen by a physician, or died in ED) was also noted.
The main reason for each patient remaining in ED was recorded at the same three hour period, and categorised into one of the groups shown in box 1.
Box 1 Reasons for delay in patient flows
-
Factors related to ED itself, (being seen, waiting for a doctor, test results, or outcome).
-
Factors related to ED-hospital interrelation (waiting for investigations performed outside ED or for a hospital specialist).
-
Factors related to hospital itself (waiting to find or to go to a hospital bed).
-
Factors not directly related to either ED or hospital (waiting for patient relatives, social worker intervention, or an ambulance).
Analysis of these data was used to perform an extensive structural and staff reorganisation of the ED. Increases in the physical and staff resources are given in table 1. Once structural reorganisation had been carried out, the initial assessment area was able to manage a volume of eight patients an hour (that is, 194 patients per day) and the treatment and observation area increased in its capacity from 25 to 41 beds. Staff were organised differently. The tasks of triage and the direct medical assistance in the initial assessment area and the treatment and observation area were previously shared by residents. After the reorganisation, their role was only to see, under close consultant control, patients in the initial assessment area. In addition, one consultant was in charge of triage and the initial assessment area, while the other was located in the treatment and observation area to take care of outcome and patient disposition.
After an adequate period of adaptation, the same measurement of patient arrivals and patient flow was performed from 10 February to 1 March 2000. Three main objectives were proposed. Firstly, to compare the patient flow throughout the day before and after the reorganisation, to assess whether previous difficulties with patient flow had been overcome. Secondly, to investigate if the reorganisation had improved the overall effectiveness of the ED. Two different effectiveness markers were measured at the same three hour periods: the “number of patients waiting to be seen”, patients waiting to enter an initial assessment area cubicle for medical assistance after the initial triage interview, and the “waiting time to be seen” calculated as the mean of waiting times of the three patients that were waiting to enter an initial assessment area cubicle for the longest time (that is, those with the highest cumulative waiting times). Finally, the third goal was to investigate effects of ED reorganisation in preventing overcrowding. An overcrowded period was defined from both a numerical and a functional point of view.3 Numerical overcrowding was defined as any three hour period with more than 15 (before the reorganisation) or 24 (after the reorganisation) patient arrivals at ED. Functional overcrowding was said to be present when lack of capacity in the treatment and observation area reduced the flow of patients into the initial assessment area.
The results were expressed as percentages and means, both with 95% confidence intervals (CI). For comparisons, χ2 test and one way analysis of variance (Student-Newman-Keuls post hoc test) were used. The relation among quantitative variables was assessed by means of simple (univariate) and multiple (multivariate) linear regression analysis.
RESULTS
As figure 1 shows, the number of arrivals per hour increased by 13% (95%CI 1% to 25%, p<0.05) after ED reorganisation. Despite higher attendance after the reorganisation, the average number of patients in ED at any given time decreased from 40.1 to 34.2 (15% of reduction, 95%CI 7% to 23%, p<0.001). This was achieved by a reduction of patients in the waiting area by 57% (95%CI 37% to 77%; p<0.001) and in the initial assessment area by 33% (95%CI 23% to 43%; p<0.001). Numbers of patients in the treatment and observation area remained unchanged. There was a 20% (95%CI 7% to 33%, p<0.01) decrease in admissions and proportion of patients discharged increased 35% (95%CI 16% to 54%, p=0.001). There were no differences between both periods in proportions of patients who either left without being seen by a doctor or died in ED.
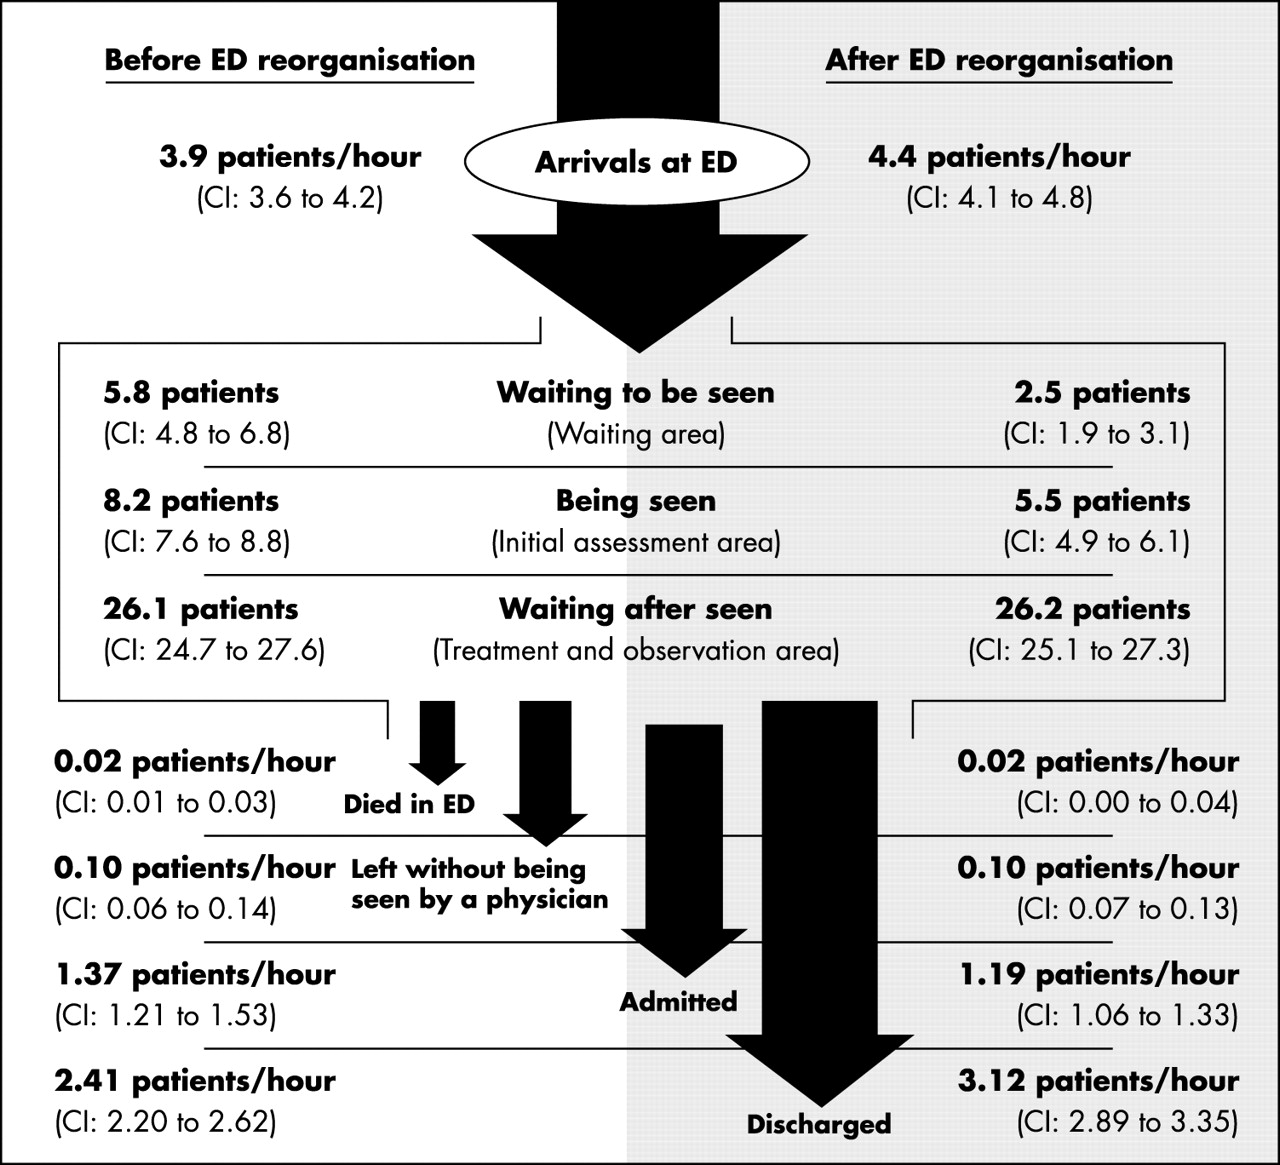
Patient flow scheme before and after ED reorganisation.
Before the reorganisation, there were several periods during the day when the capacity of the initial assessment and treatment and observation areas was exceeded. After the reorganisation, this situation was nearly resolved (fig 2). The pattern of occupancy in these two areas was not the same throughout day. The initial assessment area was significantly busier from 1200 to 2400 while the treatment and observation area occupancy exhibited a more stable pattern with just one peak at 1500.

Patient distribution in the three ED areas throughout daytime before (left) and after (right) its reorganisation. Asterisks denote those periods of time with a significant higher number of patients compared with the others.
Data on patient flows showed that those who remained in the ED because of ED related factors increased significantly after reorganisation. Patients remaining because of either hospital related or non-ED-non-hospital related factors decreased after reorganisation, although this reduction only reached statistical significance at night. When each specific internal factor was analysed, most of them displayed a significant decrease but the number of patients waiting for outcome and for investigations performed outside ED increased significantly (fig 3).

Magnitude of the change in each specific cause of patient flow delay achieved after ED reorganisation.
Against our measures of ED effectiveness, after reorganisation the number of patients waiting (NPW) decreased by 57% (95% CI 37% to 77%, p<0.001; from 5.8 to 2.5 patients), and the waiting time (WT) was reduced by 73% (95%CI 51% to 95%, p<0.001; from 87 to 24 minutes). Both effectiveness markers (NPW and WT) significantly deteriorated in association with ED related factors (such as waiting for test results) and hospital related factors (such as waiting to find or to go to a hospital bed). Non-ED-non-hospital related factors were generally less well correlated with poor effectiveness but waits for an ambulance were a significant factor (table 2).
Results of univariate and multivariate analyses about the influence of the different internal factors on effectiveness markers
Before the reorganisation, the department was considered to be overcrowded during 31% of the time periods from a numerical point of view and 48% from a functional point of view. After reorganisation these figures improved significantly, remaining only 8% and 15% of the time periods overcrowded, respectively. This result implied a 74% (95%CI 48% to 102%, p<0.001) and 69% (95%CI 46% to 92%, p<0.001) reduction in overcrowded periods, respectively.
DISCUSSION
ED layout and staffing should facilitate patient flow, improve patient care, and enable emergency staff to perform their duties more efficiently and safely. The increasing importance of the ED as a provider of community health care makes it essential to periodically review ED organisation to cope with such demands.17–20 In our study of the relation between processes involved in patient care, the analysis of the ED performance was able to demonstrate a need for reorganisation resulting in a quantitative and qualitative improvement in patient flows.
The improvements are attributable to a number of reasons. Increasing the capacity in the treatment and observation area has permitted patients waiting for outcome to be located where they ought to be, reducing overcrowding in the initial assessment area. This permits freer access to the initial assessment area and thus reducing the waiting time. However, the number of patients waiting for ED related factors has increased, especially because of the increase in patients waiting for test results and decisions over outcome. This has led to more patients being discharged from the treatment and observation area resulting in fewer (patients) waiting to find a bed and fewer admissions.
Both WT and NPW have decreased significantly since ED reorganisation. The NPW has not been measured extensively in previous studies but we feel this is an important measure of overcrowding. The WT has often been used to assess the effectiveness of an ED14,21 and is closely related to subjective patient satisfaction.22,23 This time was reduced from 87 to 24 minutes, consistent with the range between 18 and 158 minutes derived from other published studies.14,24–30
In addition, the staffing policy allows residents to see more patients in the initial assessment area than previously and allows consultants to take direct care of patients in the treatment and observation area avoiding the need for doctors to continuously move between areas. As results have demonstrated, patient disposition has changed and a higher proportion is now discharged because of the availability of a consultant in the decision making process in the treatment and observation area.
The reduced rate of admission is open to criticism as once the patients are discharged, their outcomes are not known. This prevents a reliable assessment of the measures taken because we do not know whether the patients discharged would have fared better if admitted. We have no data on re-admission rates or other adverse outcomes. However, more immediate measures of outcome such as numbers of patients leaving the ED without being seen by a physician or dying in ED suggest that quality of care has been maintained. Although not a prime focus of our study, these two well known quality markers3–5 have remained unchanged.
It is important to note that our achievements have been attained despite an increase in the number of patient arrivals. A common belief is that treatment delays generally occur within extremely busy days, particularly during periods when a mass of patients arrives within a relatively short time.17,31–33 DiGiacomo and Kramer found a positive, but not significant, correlation between rate of attendance and visit duration.34 Their analysis showed that only 15% and 22% of the variation in whole visit time was respectively attributable to the number of daily patients and the number of patient arrivals in the hour before the arrival of any particular patient. Our study not only agrees with this conclusion but also points out the specific ED related and hospital related internal factors that are responsible for ED dysfunction.
While quality and effectiveness markers have previously proved to be useful,35,36 lack of standards makes it difficult to assess the external validity of our results or to determine when a reorganisation should be performed. EDs vary substantially in terms of location, client population, human and structural resources, size and capacity of the parent hospital, number of specialists, and mechanism of revenue and reimbursement specialties. Standard setting for effectiveness and quality seems to depend on local agreement between ED staff and hospital administrators, instead of applying a general rule.37 Despite caveats on external validity, it is probable that many other EDs share intrinsic characteristics and suffer dysfunction sufficiently similar for our findings and, then, solution to be directly applicable to their own setting. EDs with different performance problems and dysfunction, solutions should focus on other internal or external factors.38,39 Even so, the method used in this study could be useful to detect such problems and investigate solutions because it was easy to apply; accurately located the focus of intervention; and demonstrated how, despite difficulty in controlling demand for emergency care, it was possible to consider aspects of supply.
REFERENCES
MEDICAL EMERGENCY SERVICES AND PATIENT FLOWS
The paper by Miro et al is a detailed survey of patient flows through a medical emergency service.1 While the ED system in Spain is different to that in UK, Australasia, and North America, we can still learn lessons from this study. The care of acute general (internal) medical emergencies is the most important challenge confronting emergency services throughout the world. The system described by Miro is similar in some ways to UK practice with patients being triaged, waiting, having an initial assessment/treatment (in the ED) then waiting for results/tests or further evaluation.
Some might ask why it took a study of this magnitude to prove if you double the numbers of beds and senior medical staff you reduce the waiting time and overcrowding but the methodology and the results are relevant and interesting.
The study claims to show that more senior doctors involved in decision making processes can decrease the proportion of patients admitted. This is an important piece of evidence but must be treated with some caution. There was an increase in the numbers of patients attending but we are given no information on the casemix, especially in regard to severity of the illness. It could be that in the second period more patients were coming with more minor problems and that this was the main reason for the increasing proportion of patients discharged. Hopefully, allowing senior staff the time, space, and facilities to properly assess patients will lead to more discharges. Importantly, the paper also provides no data on the follow up of discharged patients and thus the overall impact on patient care is not known. As acknowledged by the authors, this is a significant problem with this study.
However it gives excellent evidence that ED waits and overcrowding are very dependant on waits for test results and waits for hospital beds.
What are the implications for our practice? Many of the elements of this approach are being trialled in the UK. Early assessment teams, observation/treatment units (clinical decision units) are the exciting developments in this field. This paper gives encouragement that such changes might reduce waiting times and permit more discharges. However, the magnitude of the impact of such schemes on the long term lack capacity in the health and social care system remains unproved.
REFERENCE
Footnotes
-
Funding: supported by grant FIS 02/0479.
-
Competing interests: none declared.
Linked Articles
- Primary Survey