Article Text

Abstract
Objectives: To describe the components of an emergency and urgent care system within one health authority and to investigate ways in which patient flows and system capacity could be improved.
Methods: Using a qualitative system dynamics (SD) approach, data from interviews were used to build a conceptual map of the system illustrating patient pathways from entry to discharge. The map was used to construct a quantitative SD model populated with demographic and activity data to simulate patterns of demand, activity, contingencies, and system bottlenecks. Using simulation experiments, a range of scenarios were tested to determine their likely effectiveness in meeting future objectives and targets.
Results: Emergency hospital admissions grew at a faster annual rate than the national average for 1998–2001. Without intervention, and assuming this trend continued, acute hospitals were likely to have difficulty sustaining levels of elective work, in reaching elective admission targets and in achieving bed occupancy targets. General practice admissions exerted the greatest influence on occupancy rates. Prevention of emergency admissions for older people (3%–6% each year) reduced bed occupancy in both hospitals by 1% per annum over five years. Prevention of emergency admissions for patients with chronic respiratory disease affected occupancy less noticeably, but because of the seasonal pattern of admissions, had an effect on peak winter occupancy.
Conclusions: Modelling showed the potential consequences of continued growth in demand for emergency care, but also considerable scope to intervene to ameliorate the worst case scenarios, in particular by increasing the care management options available in the community.
- simulation
- system dynamics modelling
Statistics from Altmetric.com
NHS emergency and urgent care services have been singled out for modernisation sooner rather than later.1,2 General system ailments have been considered to include patients waiting too long at all stages in the process of contacting and accessing health care, and difficulty for patients in knowing which service to contact. UK government policy now requires commitment to a concept of local emergency care ”systems” in which health and social care services work together to meet the needs of patients.
Before the establishment of strategic health authorities in 2002, Nottingham Health Authority served a population of about 640 000 people. Nottingham has two acute general NHS hospital trusts, Nottingham City Hospital (about 660 acute beds) and Queens Medical Centre (about 844 acute beds), which has one of the busiest accident and emergency (A&E) departments in the country in terms of new patient attendances a year.3 An NHS walk-in centre opened in Nottingham in 2000, and single call access to out of hours primary care is provided for patients of Nottingham Emergency Medical Services (NEMS) Co-operative in partnership with NHS Direct. In 2001, Nottingham Health Authority commissioned an independent research study to review its system of emergency and urgent care.
Although previous studies have highlighted the relation between deprivation and demand for emergency care in Nottingham,4–6 have described local emergency care systems,4,7 have considered the local impact of changing systems,8,9 and have modelled emergency department dynamics,10 this has often been undertaken without examining the impact of system change on the wider health economy.
The objectives of the study were (1) to describe the configuration of the local emergency and urgent care system in terms of its “front door” services, and patient pathways through the system, (2) to review recent demand for emergency and urgent care and patient flows through the system during the period April 1998 to March 2001, and (3) to assess the potential system effects of achieving local stakeholder proposals for change.
METHODS
Brief introduction to system dynamics
System dynamics (SD) is an analytical modelling methodology, the origins of which are attributed to Forrester11,12 in his pioneering work on ”industrial dynamics” in the 1960s. Today, SD methodology is used beyond the industrial setting and has been applied in many different fields of study including health care.13 SD combines both qualitative and quantitative aspects and aims to enhance understanding of complex systems, to gain insights into system behaviour. The qualitative aspect entails the construction of “causal maps” or “influence diagrams” in which the system structure and the interrelations between the components of a system are explored. The quantitative aspect entails the development of a computer model in which flows of material or information around the system are modelled and bottlenecks identified. Such models can then be used in a “what if” mode to experiment with alternative configurations, flows, and resources. In the health care context, this entails modelling patient pathways, information flow, and resource use. A recent example is Lane’s model of A&E,10 which showed the relation between waiting times in A&E and bed closures. The key finding of this model was that the major impact of bed shortages was not on emergency admissions, but was felt first on elective admissions, so that using A&E waiting times to measure the effect of bed shortages is misleading.
Qualitative phase: stakeholder interviews
A preliminary sketch of the system was drawn up in August 2001 describing “front doors” to the emergency and urgent care system and distinguishing between patients arriving in person or making contact by telephone. This was expanded to form a first conceptual map of patient pathways through the system. Thirty interviews were conducted with clinicians (acute medicine, emergency care, general practice, public health, nursing, and diagnostics); planning and commissioning managers, and operational staff involved in patient records and bed management. Twenty were people recommended by the local project steering committee, others were chosen to maximise variety in the interview sample. Interviews were semi-structured and were tape recorded with the consent of participants. Interviewees annotated a copy of the conceptual map, correcting or adding information so that it best represented the system as they understood it (after Rosenhead14) and identified the relative influences between the system components and any bottlenecks for patient flows through the system.
Annotated maps were reviewed iteratively to develop a master conceptual map so that later interviews used revised versions, though the basic structure remained similar. The elements were the primary care sector including the “front doors” NHS Direct and the NHS walk-in centre; NHS and commercial general practice services (in hours and out of hours), the two acute trusts and the wards that were primarily involved in handling emergency admissions; the ambulance service and the A&E department. Figure 1 shows a highly simplified version of the final map.
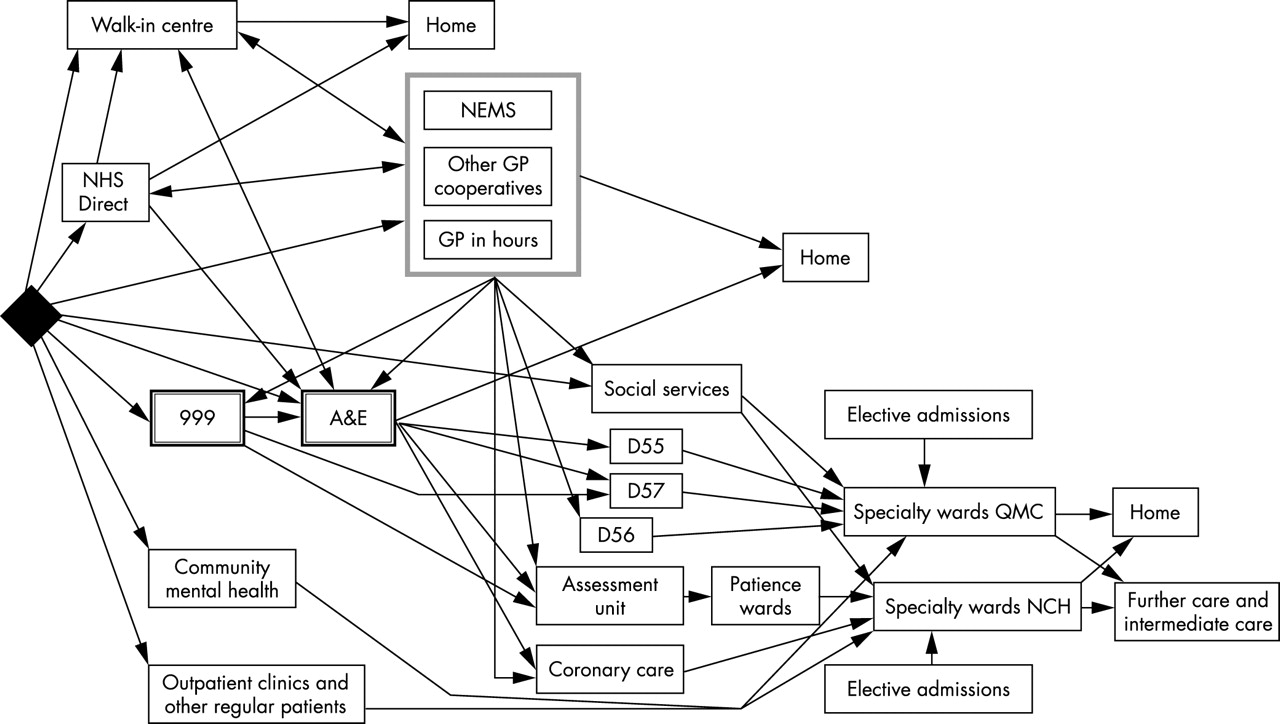
Simplified “conceptual map” of the emergency healthcare system in Nottingham. D55, D56, and D57 are acute admission wards in QMC, and the Patience wards are admission wards in NCH.
Quantitative phase: the computer model
The finalised conceptual model was then translated into a computer model using the software stella (High Performance Systems, Hanover, NH). This was also an iterative process involving discussions with the project team and steering group, as well as other health professionals in Nottingham, to clarify the assumptions and develop the model. stella enables complex detail to be concealed within “sub-models”, allowing the user to “zoom in” on selected parts of the system and display lower level detail hidden from view in the top level model. Sub-models were constructed for each of the “front door” services, including A&E, though a separate, more detailed model was constructed for A&E, capable of working with time intervals of hours and minutes, and is not discussed here.
The data needs for the model were identified by examining each area in the model, and determining what data would be required to describe each “flow”. Data needs were consolidated into a data request sheet for each provider, and these formed the basis of a letter and request for data, sent to each provider organisation. Mid-year estimates of population size were obtained from the Office of National Statistics for the years 1998, 1999, and 2000 (key population and vital statistics: local and health authority areas: population and vital statistics by area of usual residence in England and Wales)15–17 and from Department of Health (hospital episode statistics).18 Table 1 shows a summary of the model inputs and outputs. System wide primary care data were not obtainable so we used the hospital data for admissions from daytime general practice. As the new NHS Direct East Midlands provided a service for a substantially larger population (3.5 millions) than for Nottingham alone (0.7 millions), contacts were defined as those concerning people resident within the Nottingham Health Authority area, determined by postcode. To some extent, a cross boundary flow effect also applies for ambulance and A&E data, although we expected this to be aggregated out over time. Ambulance service data were for patients transported to one of the hospitals within Nottingham Health Authority, and were available for the year April 2000 to March 2001 only. Waiting times are not explicitly calculated as stella does not model individual patients: the model is concerned with aggregate flows and bottlenecks.
Summary of stella model inputs and outputs
Data and model validation
The model was populated with activity data and run for one simulated year to ensure that the model was valid and was producing output in line with the data. This showed that the model was producing credible output and reasonably good correspondence between the model and the data. For example, from Nottingham City Hospital we had daily data on bed occupancy rates and these were plotted against the model output (fig 2). It can be seen that on day 309 (26 January 2001) in January 2001 the model predicted that occupancy would exceed 100%. Although occupancy was high in this period, it actually peaked at 96%. It is important to note that the model will give an indication of the behaviour of the system, but because of the necessary simplifications it cannot give mathematically accurate predictions. The model was then run for five years assuming (unrealistically) zero growth in demand and zero increase in resources. This was taken as the baseline run against which all subsequent scenarios were compared.

Daily bed occupancy rates at one acute hospital, plotted with output from the stella model to test credibility of the model output.
“What if” scenarios
A range of scenarios to be tested in the model was generated in discussion with the project steering group (box). The scenarios were considered to be realistic in the sense that they were either plausible projected changes in demand, or proposed interventions. So, for example scenario 3 tested 3% and 6% reductions in emergency admissions for patients over 65 years. A study of variation in hospital admission rates between general practices in one health authority showed a twofold difference between the 10th and 90th centile for all emergency admissions, although sociodemographic patient factors alone accounted for 45% of the variation in emergency admission rates.19 There is good evidence that specific interventions (including hospital at home schemes, and comprehensive care of older people) can reduce acute hospital admissions.20 We were not concerned with the precise mechanisms for achieving these hypothetical changes, but with analysing their effects on the secondary sector. The lack of general practice data meant the model was not able to investigate the effects of such changes within the primary sector, and this is an area for further research.
RESULTS
Patterns of activity in the emergency care system
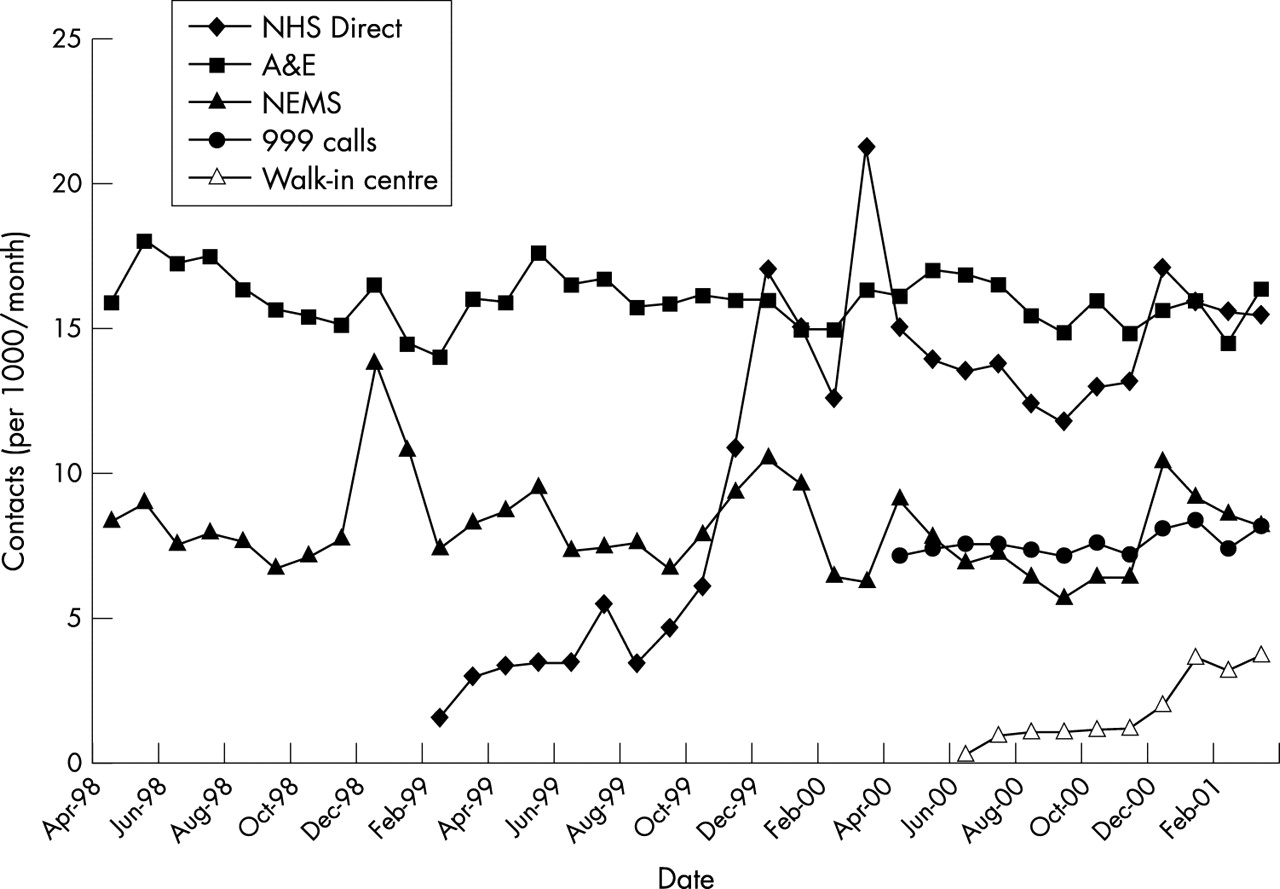
With the exception of NHS Direct and the NHS walk-in centre, the number of patient contacts with front door services did not increase in the period 1998–2001 (fig 3). The data suggest that demand for NEMS in December 1999 and January 2000 was modified by the integration with NHS Direct, with a corresponding increase in NHS Direct contacts. Some seasonal variation can be observed in the data around public holiday periods. Table 2 shows total contact rates per 1000 population per year for each of the front door services for which data were available. A&E attendance rates over the period were relatively constant: 192 per 1000 population/year in 1998–1999 and 191 per 1000 population/year in 2000–2001. (Calculating rates using the population estimates for Nottingham Health Authority underestimates the size of population that in practice will use A&E services at QMC, and therefore over will somewhat overestimate contact rates per 1000 per year).
Contact rates per 1000 population/year with “front door” services

Number of patient contacts per 1000 population/month with “front door” services in Nottingham (April 1998–March 2001).
“What if” scenarios selected for testing in the STELLA model
1 Five year outlook
A five year run of the model, using 2000–2001 data assuming
-
4% year on year growth in emergency admissions
-
3% year on year growth in GP referral for planned admissions
This would include an analysis of the alignment of the output with current national performance targets.
2 Changing “front door” demand
The impact of increase in demand for “front door” services
3 Reducing emergency admissions
-
patients in particular disease groups, for example, respiratory or coronary problems
-
patients with ill defined conditions
-
patients over 65 years
4 Earlier discharge
The effects of earlier discharge of patients admitted as emergencies and subsequently discharged to nursing or residential homes.
5 Beds crisis
The effects on the system of one or more ward closures, for example because of MRSA.
Emergency admissions to both acute general hospitals rose during the study period. For Queens Medical Centre, this constituted a year on year increase of 4.7% in 1999–2000 and 5.6% in 2000–2001; and for Nottingham City Hospital, a year on year increase of 2.3% in 1999–2000 and 10.1% in 2000–2001. Table 3 shows emergency hospital admissions as rates per thousand population per year.
Rate of emergency admissions (per 1000 population/year) at Nottingham City Hospital and Queens Medical Centre, Nottingham, 1998–2001
Model results
The baseline run of the model showed that both acute hospitals were exceeding the average 82% occupancy target.1 The annual average occupancies produced by the baseline run were 84.7% for Queens Medical Centre and 86.7% for Nottingham City Hospital. Further results of the modelling are shown in relation to the five main scenarios tested.
Scenario 1: five year outlook
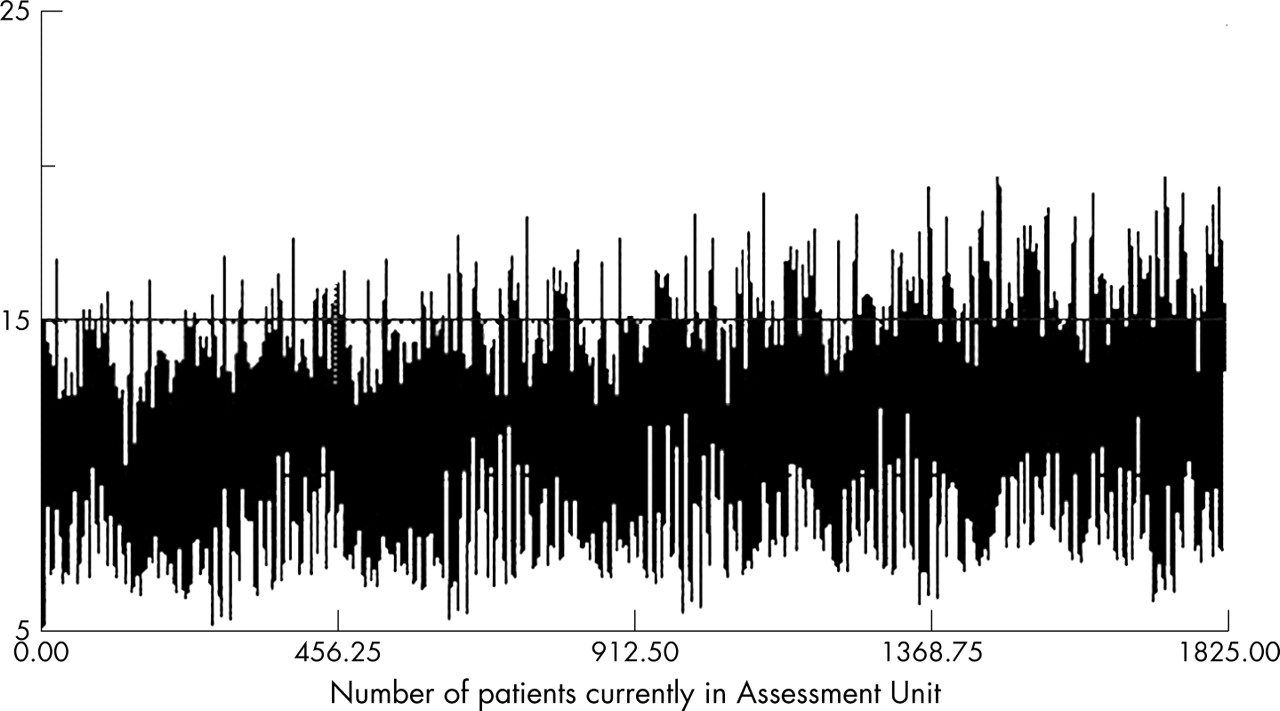
Based on a five year run of the model using 2000–2001 data, the model suggested that without any interventions, both acute hospitals would experience substantial difficulties in the future in meeting elective admission targets. If emergency admissions continued to increase at the rates observed, it would not be possible to maintain the current levels of elective work. Assuming a 4% annual increase in emergency admissions, that both hospitals continued to admit elective patients at the 2000–2001 rates, and that lengths of stay for emergency and elective patients remained unchanged over the period, the model showed that this level of emergency admissions would only be achievable if over 100 extra acute beds were made available in each hospital by 2005. The alternative, all other things being equal, would be the cancellation of elective admissions. By the busiest period of the winter of 2005–2006, 400 elective admissions per month could be cancelled. Additionally, there would be a knock on systemic effect of such cancellations, in that many of these patients would subsequently be admitted as emergencies because their condition would have deteriorated due to the delay in their diagnosis and treatment. An output from the stella model shows the impact of continued rise in emergency admissions (scenario 1) on bed occupancy at the Nottingham City Hospital Assessment Unit. Here, occupancy exceeds 100% with increasing frequency over the five year period (fig 4). In practice, this means that the 15 beds are all occupied and the additional patients are accommodated on trolleys around the ward—this already happens at particularly busy periods.
stella plot of occupancy of the Assessment Unit, Nottingham City Hospital in scenario 1. The horizontal line (15 beds) indicates 100% occupancy. The density of the graph reflects that data were plotted every 2.4 hours for five years, and shows extreme daily variability.
Scenario 2: changing front door demand
In comparison with the baseline, re-directing varying proportions (25%, 50%, 75%) of patients assigned triage category 4 or 5 from A&E to the NHS walk-in centre is shown by the model to have a substantial effect on A&E daily throughput, reducing daily throughput by a maximum of 100 patients per day. However, additional resources could be required in the NHS walk-in centre, and the practicalities and acceptability of re-directing patients in this way would need to be considered. The model suggests that further gains may arise if the NHS walk-in centre opened for longer hours (for example until midnight), though patient satisfaction with walk-in centre care might reduce if waiting times there increased. There is evidence from the data that waiting times in A&E and the walk-in centre are closely correlated, with long waits in A&E occurring at the same time as long waits in the walk-in centre. Where appropriate, some patients who might ordinarily be transported to A&E by ambulance are taken to the NHS walk-in centre, but the data show that this happened infrequently during 2000–2001.
Scenario 3: reducing emergency admissions
The model suggested that referrals from general practice were the most important source of emergency admissions to hospital, irrespective of whether patients were admitted via A&E or directly to specialty wards, and there appeared to be considerable opportunity to intervene to reduce avoidable emergency admissions in this area. For example, reducing emergency admissions referred by general practitioners by 4% year on year showed a 1% annual decrease in average annual occupancy levels. Nottingham City Hospital benefited proportionally more than Queens Medical Centre in this scenario, seeing a decrease in average annual occupancy from 85% to 81% over the five year period. The occupancy of Queens Medical Centre decreased from 84% to 82% over the same period. This was an example of a case where a focused change in referral practice had a greater impact elsewhere in the system than might have been expected.
Interventions targeted for patients with specific clinical problems, such as respiratory conditions or ill defined diagnoses, did have an effect within the model, although it was not large. Reducing emergency admissions of patients with pulmonary problems (HRG codes D20, D21, and D22) by 20% per annum year on year for four years, reduced overall bed occupancy by about 2%, a small annual effect. However, the seasonal nature of the reductions in admissions gave increased benefits, as the January peak in occupancy was more significantly reduced relative to other months.
Interventions aimed at preventing 3% or 6% of emergency admissions of patients over 60 years of age made a substantial difference in the model. Even without assuming any decrease in average length of stay, bed occupancy in both hospitals was reduced by 1% per annum over the five year duration. This is to be expected bcause older people (aged 66 and over) comprise around about half of all emergency admissions.
Scenario 4: earlier discharge
A small proportion of patients admitted as emergencies were discharged to nursing homes (around 1% for both hospitals). Discharging these patients two days early made hardly any difference to overall occupancy rates, and there appeared to be little potential for improvement in this area. We also investigated the effects of seven day a week discharging from hospital. This showed a small decrease in occupancy though some care needs to be taken in interpreting the model results here, as the admission days for elective patients are currently planned to accommodate weekday discharging. However, because elective patients only formed the minority (34%) of admissions to Nottingham City Hospital and just over half (53%) of admissions to Queens Medical Centre in 2000–01, we could still expect to see some benefits from this.
Scenario 5: beds crisis
In this scenario we considered the effects of a short term loss of beds attributable to staffing shortages or other events such as an outbreak of MRSA, and staged this hypothetical event for a one week period in November of year 2 in the model and assumed that 30 beds would be lost in each of the two main hospitals. The impact on occupancy here was minimal.
DISCUSSION
This study described the configuration of the local emergency and urgent care system in one health authority in terms of its “front door” services, patient pathways through the system, and demand for emergency and urgent care.
Pronounced rising demand for emergency admission to hospital was shown to be the factor most associated with exacerbating already high levels of acute bed occupancy in Nottingham. In turn, high levels of bed occupancy were instrumental in producing “bottlenecks” in patient flows through the system.
The conceptual map provided a useful structure around which to base the stakeholder interviews, and participants often commented on the value of seeing the whole system in its entirety, often for the first time, and on the insights they gained about how other system components related to the part with which they were familiar. The computer model was useful for investigating the scenarios for change in terms of patient flows and bottlenecks and as a device for facilitating discussion and comment. Modelling permits risk free experimentation and encourages creative thinking and imaginative solutions. This type of model does not produce precise numerical forecasts, but is an investigative tool permitting comparison of the relative benefits, and potential consequences, of various options for change. In this sense it can suggest what might be done, but not the desirability of such options and, without economic data, cannot predict the probable costs or cost savings.
The study had two main limitations. Firstly, it relied on the availability of routine activity data from a range of providers and more primary care data would have been needed to describe the impact of daytime general practice care in the model. The achievement of a common dataset for emergency care remains an important goal. Secondly, the findings of the model were dependent on the assumptions made in its development. Assumptions that are valid in Nottingham may not be valid elsewhere.
The local project steering committee referred to scenario 1, the worst case projection, as the “doomsday scenario”. None the less the model showed the potential effectiveness of a range of modest and, arguably, achievable measures, to prevent this being realised.
ETHICS COMMITTEE APPROVAL
This study was approved by Trent MREC. Reference number MREC/01/4/08.
Acknowledgments
We thank the health and social care staff who assisted us in the conduct of this study and Dr Stephen Shortt, Mr James Scott, Mr John MacDonald, Dr Doug Black, and the local steering committee for their contribution. We also thank Mr Steve Baxter and Mr Shaun Leah for their assistance in providing data. Nottingham Health Authority funded the project but the views expressed in the paper are those of the authors alone. We also thank the referees for their helpful comments.
CONTRIBUTORS VL led the main project and prepared the overall study design. SB designed and led the SD modelling component with assistance from PT. VL, SB, HS, and JT conducted the interviews and with SG and KG developed the system map and data requirements. VL, SB, JT, and SMP collected data from providers and JT undertook data cleaning and analysis. VL and SB drafted the final paper with contributions from the wider team, and are the guarantors.
Footnotes
-
Conflicts of interest: none declared.