Article Text

Abstract
Objective Early prediction of admission has the potential to reduce length of stay in the ED. The aim of this study is to create a computerised tool to predict admission probability.
Methods The prediction rule was derived from data on all patients who visited the ED of the Rijnstate Hospital over two random weeks. Performing a multivariate logistic regression analysis factors associated with hospitalisation were explored. Using these data, a model was developed to predict admission probability. Prospective validation was performed at Rijnstate Hospital and in two regional hospitals with different baseline admission rates. The model was converted into a computerised tool that reported the admission probability for any patient at the time of triage.
Results Data from 1261 visits were included in the derivation of the rule. Four contributing factors for admission that could be determined at triage were identified: age, triage category, arrival mode and main symptom. Prospective validation showed that this model reliably predicts hospital admission in two community hospitals (area under the curve (AUC) 0.87, 95% CI 0.85 to 0.89) and in an academic hospital (AUC 0.76, 95% CI 0.72 to 0.80). In the community hospitals, using a cut-off of 80% for admission probability resulted in the highest number of true positives (actual admissions) with the greatest specificity (positive predictive value (PPV): 89.6, 95% CI 84.5 to 93.6; negative predictive value (NPV): 70.3, 95% CI 67.6 to 72.9). For the academic hospital, with a higher admission rate, a 90% probability was a better cut-off (PPV: 83.0, 95% CI 73.8 to 90.0; NPV: 59.3, 95% CI 54.2 to 64.2).
Conclusion Admission probability for ED patients can be calculated using a prediction tool. Further research must show whether using this tool can improve patient flow in the ED.
- crowding
- emergency department
- hospitalisations
- planning
- management
Statistics from Altmetric.com
Key messages
What is already known on this subject
Increasing length of stay in EDs diminishes quality of care.
The delay before hospitalisation at the ED may be reduced by early prediction of hospital admission.
What this study adds
We derived a simple admission prediction tool and validated it on three independent groups of patients.
The tool can be incorporated into the electronic record and is currently in use at our site.
Introduction
Increasing length of stay in EDs diminishes quality of care and is associated with decreased patient satisfaction, increased morbidity among ventilated patients and increased mortality among critically ill patients.1 The decision whether to admit a patient is often postponed until all results of laboratory testing, radiological studies and consultations from different specialists are available. It might therefore be helpful to know upfront what the probability of hospitalisation is for an individual ED patient. This may help the treating emergency physician to anticipate a hospital admission, thereby reducing the length of stay in the ED.
Multiple studies have looked at factors that predict hospital admission, and many decision models have been developed. However, most of these previous studies concentrated on specific diseases or a subgroup of patients.2–15 A few earlier studies focused on predicting hospital admission for the entire ED population, but these used only limited patient data.16–19
With this study, we aimed to develop one, broadly applicable, prediction tool that could be applied on the entire, undifferentiated ED population at multiple sites. We wanted to create a prediction tool that is easy to use, right from the start of the ED consultation.
Methods
The derivation of the prediction tool was performed in the ED of Rijnstate Hospital, a 955-bed community teaching hospital in the Netherlands, which covers an area with 460 000 inhabitants. In 2011, there were 41 806 ED visits, of which 12 050 patients (28.8%) were admitted. The hospital has a separate department for emergency cardiology, which means referred cardiology patients are not seen at the ED. Triage is performed using the Manchester Triage System (MTS).20 After approval from the local ethics committee, all patients who visited the ED between 10 and 16 January and between 9 and 15 May 2011 were included. Two separate periods were chosen to account for seasonal variation. Based on expert opinion and review of the literature, the following factors that might influence hospital admission were identified and collected from all included patients: sex, age, type of main symptom, MTS category, arrival mode (own initiative, referral by general practitioner, ambulance and otherwise), medical history (categorised by organ system), laboratory tests performed, radiological imaging performed and day of the week. These data were prospectively collected. We included as admissions patients who died in the ED and those who were transferred to another hospital due to bed shortages or need for specialist care.
Descriptive statistics were used to describe the patient population. The Fisher exact test was used to explore the relation between factors associated with hospitalisation. Next, a multivariate logistic regression analysis was performed on all factors to identify independent factors. From this analysis, the most contributing (with the highest ORs) and readily available factors were selected. Subsequently, to build the prediction model, the multivariate logistic regression analysis was performed again, including only these four factors. The predicted probability of hospitalisation for the individual patient was defined as  , in which β0 is the intercept and βn are the regression coefficients of the corresponding factors.
Validation of the prediction model was done at three sites. A sample size calculation calculated a total of 250 admitted patients necessary for validation of this model. One validation site was the original hospital, in which we prospectively collected a new dataset of patients visiting the ED at the Rijnstate Hospital between 5 and 13 December 2011. The model was also validated at the Canisius-Wilhelmina Hospital (CWH), a community-teaching hospital with 455 beds and 26 000 ED visits in 2015, from which 40% was admitted to the hospital, and Radboud University Medical Center (RadboudUMC), an academic hospital with 564 beds and 18 907 ED visits in 2015, from which at least 38% was admitted. Data were prospectively collected. Both hospitals have separate departments for emergency cardiology (referred cardiology patients are not seen at the ED). Triage at the CWH is performed using the MTS, and the RadboudUMC uses the Netherlands Triage System (NTS). The NTS is a similar triage system based on three systems, namely the MTS, the Telephone Guide of the Dutch College of General Practitioners and the National Standard for Dispatch Centre Ambulance Care (online supplementary appendix 1).21
Supplementary file 1
To assess the discrimination power of the prediction model, the area under the receiver operating characteristic (ROC) curves were quantified. To evaluate the calibration of the model, a calibration plot was created (for the Rijnstate Hospital, the validation dataset was used to create the calibration plot). All data were analysed in SPSS Statistics (PASW Statistics for Windows, V.21.0).
Finally, the prediction model was transferred to Microsoft Excel to create a simple admission prediction tool.
Results
The derivation set included 1 261 ED patients that visited the ED of Rijnstate Hospital. Four hundred of these patients (31.7%) were admitted (figure 1).
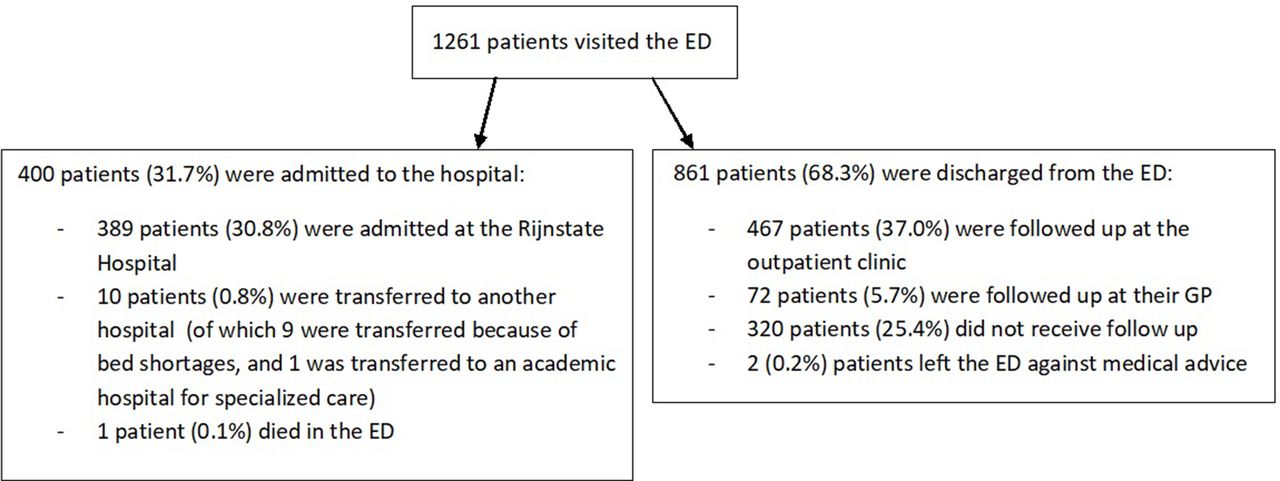
Flow sheet of patients that presented to the ED of the Rijnstate Hospital (derivation dataset). GP, general practitioner.
Almost all preconceived factors were significantly related to hospitalisation (online supplementary appendix 2). Most frequently admitted were: females, elderly (above 60 years), patients in more urgent triage categories, arriving by ambulance (especially when the patient was first seen by a GP), on whom laboratory testing or radiological imaging was performed, and patients with certain types of symptoms and medical histories. The specific day of the week did not have a significant relation with the chance of hospitalisation; however, more patients visiting the ED on a weekday than weekend were admitted to the hospital.
Supplementary file 2
Multivariate logistic regression analysis on all factors was performed (online supplementary appendix 3). We selected the four most predictive and readily available factors: age, triage category, arrival mode and main symptom. Among these, several variables resulted in quasicomplete separation, meaning a patient in that category was never or always hospitalised; these patients were given a probability of hospitalisation of either 0 or 1 and were excluded from the regression analysis. Then, the multivariate logistic regression analysis was conducted on the remaining patients, including only the four selected factors (table 1).
Supplementary file 3
Multivariate logistic regression analysis for hospital admission
Validation
The model was applied to data from 850 patients visiting the ED of Rijnstate Hospital between 5 and 13 December 2011. This resulted in an area under the ROC curve of 0.88 (95% CI 0.85 to 0.90). With an admission probability of 80% chosen as cut-off in the ROC curve, this would result in a possible earlier admission of 12.1% of ED patients, from which 86.7% was actually admitted. Thus, applying this model results in a possible earlier admission of 31.1% of all hospitalised patients. The calibration plot has an intercept of 0.023 (almost 0, which indicates predictions are not systematically too low or too high) and a slope of 0.974 (almost 1, which indicates there is no overfitting of the model).
For multicentre validation of the prediction model, additional data from two other EDs were collected. This resulted in two extra datasets, consisting of respectively 560 patients visiting the ED of the CWH between 1 and 8 May 2016, of which 44.7% was admitted, and 503 patients visiting the ED of the RadboudUMC between 22 and 31 March 2016, of which 49.7% was admitted. Patient characteristics are shown in online supplementary appendix 4.
Supplementary file 4
To study the effect of the prediction model in large community hospitals, the datasets from Rijnstate Hospital and CWH were combined. This resulted in an area under the ROC curve of 0.87 (95% CI 0.85 to 0.89) (figure 1). Chosen an admission probability of 80%, this would result in a possible earlier admission of 14.1% of ED patients, from which 89.6% was actually admitted. Applying the prediction model results in a possible earlier admission of 33.1% of all hospitalised patients, of all non-hospitalised patients 2.4% would be wronlgy admitted (table 2). The calibration plot has an intercept of 0.05 and a slope of 0.98. The results for the individual hospitals can be found in online supplementary appendix 5.
Supplementary file 5
Comparing percentages of earlier admissions and wrong admissions for different admission probabilities
For the RadboudUMC (academic hospital), the application of the prediction model resulted in an area under the ROC curve of 0.76 (95% CI 0.72 to 0.80) (figure 2). The optimal admission probability as cut-off in the ROC curve was 90%. This would result in a possible earlier admission of 19.7% of ED patients, from which 83.0% was actually admitted. Applying the prediction model results in a possible earlier admission of 33.3% of all hospitalised patients, of all non-hospitalised patients, 6.6% would be wrongly admitted (table 2). The ROC curves of the multicentre validation of the prediction model are shown in figure 2.

ROC curves, validation of the prediction model in two community hospitals, one academic hospital and all hospitals combined. ROC, receiver operating characteristic.
The developed prediction model was then converted into a simple prediction tool in Microsoft Excel. The user selects the value for each variable, resulting in a probability of hospitalisation for the individual patient (figure 3). Next, the tool can be incorporated in electronic records (as already done in the Rijnstate Hospital, where Chipsoft EZIS V.5.2 is used), so the admission probability can easily be determined for the individual ED patient. The system automatically fills in the factors age, triage category and mode of arrival. Only the main symptom has to be selected from a list.

Two examples of applying the prediction tool on an individual patient.
Discussion
This study evaluates factors predicting hospital admission for a mixed population of ED patients in the Netherlands. Four factors were selected to create a prediction model. The prediction model was validated in three hospitals and showed to be useful to predict hospital admission for the individual patient directly after triage. The model was best applicable in the two community hospitals, both using the MTS. A computerised admission prediction tool was developed, which could help emergency physicians and triage nurses anticipate a hospital admission and possibly improve patient throughput in the ED.
This study found several factors contributing to the chance of hospitalisation. In the past, multiple studies studied factors predicting hospitalisation for patients in the ED. However, most of these studies concentrated on specific diseases, often chronic obstructive pulmonary disease,4 6 10 14 but also fractures,7 8 15 allergic reactions to food,2 syncope,5 heat illness,9 urinary tract infections,11 transient ischaemic attacks12 and soft tissue infections in injection drug users.13 These studies found that patients admitted to the hospital were older,4 8–12 14 more frequently arrived by ambulance,2 4 more frequently were triaged in urgent categories4 6 10 and had more comorbidities.5 8 9 12 14 When looking at gender, varying outcomes were found between the studies.4 8 10–12 14 Two studies found that patients visiting the ED on a weekday were more frequently admitted.8 11 Several studies also looked at socioeconomic status but found varying outcomes.9 11 12 14 15 Consistent with previous studies, this study found that higher age, arrival by ambulance, urgent triage category, presentation on a weekday and various comorbidities are related to hospital admission.
In contrast to the above-mentioned studies, this study focused on the entire ED population. In the last years, several studies looked at the full scope of ED visits and developed models to predict hospital admission. Two studies found that age, triage category and arrival mode were predictive of the need for admission.16 17 Kim et al 17 also found that sex, presenting symptoms, triage time of day and whether patients were triaged over the weekend were significant predictors of hospital admission. Peck et al 18 tested different statistical methods to predict hospital admission and found that the logit-linear regression model performed best, making use of four factors: age, primary complaint, bed type designation (fast track bed or standard ED bed) and arrival mode. Handly et al 19 added coded chief complaint data to an hospital admission prediction model (using only demographic, operational and triage acuity data) and found that this increased specificity. The results of our study are consistent with previous studies looking at the entire ED population, finding similar patients factors predicting hospital admission. Earlier studies also used logistic regression to develop prediction models. However, although previous studies included large numbers of patients, the prediction models developed in these studies were not multicentre validated, and these studies did not develop a computerised prediction tool. No previous European studies were found in which a model to predict the risk of hospitalisation was developed including the entire ED population.
Previous studies have shown mixed results of admission prediction by triage nurses.22–25 The benefit of the introduction of an easy-to-use computerised prediction tool is that it can be used by triage nurses to reliably predict admission very early in the process of an ED visit, even before a physician had time to examine the patient, while taking away interpersonal variation between triage nurses in their ability to predict admission. One study from the USA stated it takes approximately 5 hours from triage to a request for an inpatient bed in their ED.23 This means that the implementation of a reliable prediction tool can have a significant impact in the reduction of waiting times at the ED, by sending bed requests early on. In addition, such a prediction tool provides an indication of the incoming bed demand and can be used to inform the staff of inpatient departments. As crowding is an increasing problem in EDs worldwide, every effort should be made to optimise patient flow through the ED, to minimise unwanted consequences of crowding. Implementing our admission prediction tool could contribute to a better patient flow.
To the best of our knowledge, no admission prediction tool has been tested in practice. At this moment, the prediction tool is already incorporated into the electronic patient records of the Rijnstate Hospital. This means that every physician in this ED can easily determine the admission probability of their patient. In a future study, we want to test whether triage nurses can use this tool to predict admission for individual ED patients as they enter the ED and whether length of stay at the ED is reduced by implementing this tool.
Strengths and limitations
This study developed and validated a model to predict hospital admission for individual patients arriving at the ED, using only four patient factors. It is easy to use and can predict admission directly after the patient enters the ED. The prediction model was validated in three hospitals, including two community hospitals and one academic hospital. To the best of our knowledge, this is the first European study in which an admission prediction tool was developed, applicable on the entire ED population.
The prediction model performed less in the academic hospital, probably partly due to the different triage system and different patient population. This study used a classification of symptoms that was not validated. Furthermore, it was performed in the Netherlands, which may limit its predictability in other countries.
In all three included hospitals, patients referred to be seen by a cardiologist are sent to a separate emergency cardiology department. Patients who self-refer with possible cardiac complaints are primarily seen at the ED. In the Netherlands, this organisation is common, and a lot of hospitals have separate emergency cardiology departments. This means the prediction tool is not validated for patients who are referred with cardiac complaints. However, in EDs with integrated emergency cardiology departments, this tool could still be used in the rest of the ED population.
Sometimes the specific diagnosis is necessary to admit a patient (to determine the right department for admission). This means that for a small percentage of ED patients, the prediction tool will not speed up the admission. However, for most patients, it is clear for which specialty they would be admitted early on. In addition, in the Netherlands, an increasing number of hospitals work with ‘acute admission departments’, where patients can be admitted for variable specialties, before all results of diagnostics are known and where the admitting specialty can easily be changed (without moving the patient to another department).
Conclusion
With a computerised prediction tool, the probability of hospital admission for a mixed population of ED patients can be calculated with data directly available after triage. Further research is needed to show whether the use of such an admission prediction tool can reduce length of stay in the ED and therefore reduce crowding.
Abstract translation
This web only file has been produced by the BMJ Publishing Group from an electronic file supplied by the author(s) and has not been edited for content.Acknowledgments
The authors wish to thank Rogier Donders for his contribution to the statistics and Dax Hassell for correcting textual errors.
References
Footnotes
Contributors NK, ME, DR and LR were involved in the study design. NK collected the data for the Rijnstate Hospital and primarily wrote the manuscript. LvdB collected the data for the CWH. LH collected the data for the RadboudUMC. LR performed the statistics. All authors revised the manuscript several times and approved the final version.
Funding The authors have not declared a specific grant for this research from any funding agency in the public, commercial or not-for-profit sectors.
Competing interests None declared.
Patient consent Not required.
Provenance and peer review Not commissioned; externally peer reviewed.
Data sharing statement We have several datasets concerning this study: the derivation and validation dataset of the Rijnstate Hospital and the validation datasets of the CWH and RadboudUMC. These datasets are available to NK and LR. LvdB is in possession of the dataset of the CWH, while LH is in possession of the dataset of the RadboudUMC.
Author note The prediction tool will be available on contact with the corresponding author.