Article Text

Abstract
Various approaches have been used to identify possible routes for improvement of patient flow within an emergency unit (EU). One such approach is to use simulation to create a ‘real world’ model of an EU and carry out various tests to gauge ways of improvement. This paper proposes a novel approach in which simulation is used to create a ‘perfect world model’. The EU at a major UK hospital is modelled not as it is, but as it could be. The ‘efficiency gap’ between the ‘perfect world’ and the ‘real world’ demonstrates how operational research can be used effectively to identify the location of bottlenecks in the current ‘whole hospital’ patient pathway and can be used in the planning and managing of hospital resources to ensure the most effective use of those resources.
- Emergency unit
- simulation
- waiting times
- staffing
- targets
- management
Statistics from Altmetric.com
Introduction
Emergency units (EUs) often struggle to meet demand. A common operational response to these events is to increase trolley capacity in the unit. As a consequence, greater expenditure is incurred resulting in an increase in average unit costs and, in many circumstances, only a transient improvement in performance is realised.
In response to this problem, Cardiff and Vale Health Board collaborated with the School of Mathematics at Cardiff University to determine:
-
whether further investment in the emergency department was indeed warranted;
-
whether the allocation of resources within the emergency and assessment units could be improved;
-
whether capacity in the emergency department was being used to compensate for constraints beyond the EU.
We used discrete event simulation to explore and describe how an EU may be optimally configured in a ‘perfect world system’, where no resource or process constraints outside of the emergency and assessment units are assumed to exist. This approach enabled the emergency department's performance and resource requirements in a ‘perfect world system’ to be compared with those observed with the existing configuration of the service. As a consequence, the opportunities to quantify the ‘efficiency gap’ and to improve quality and reduce costs could be determined.
The specific aims of the study were to inform decisions as to the optimal staffing levels, numbers of trolleys and financial resources that are required in the emergency and assessment units to meet patient access targets and to deliver a cost-effective service. In undertaking this analysis, we wished also to explore whether existing EU and assessment areas were being used to compensate for constraints (bed capacity, in particular) further downstream.
Methodology
The existing service
The University Hospital of Wales is a large teaching hospital based in Cardiff. According to figures published by the Welsh Assembly Government, during April to June 2010 there was an average of 935 beds available each day. The occupancy for the general adult inpatient beds, excluding paediatrics, critical care and obstetric beds, was 96%.
The EU comprises three main units: the accident and emergency department (A&E), a medical assessment unit (MAU) and a surgical assessment unit (SAU). The A&E is divided into five further areas: a resuscitation area, a high-dependency unit (HDU), a trolley bay (TB), a minor injuries area (minors) and a paediatric centre. For the purpose of this work, the capacities of these departments will correspond to the default trolley capacity of each area. The capacities of the EU are as follows:
-
Resuscitation: three trolleys
-
HDU: eight trolleys
-
TB: 10 trolleys
-
Minors: eight trolleys
-
Paediatrics: five trolleys
-
MAU: 14 trolleys
-
SAU: 21 trolleys
Arrivals to the EU are classified into six groups: resuscitation, majors, minors, referrals from general practitioners (GPs), major paediatric and minor paediatric.
Resuscitation patients will first spend some time in the resuscitation area. After this, they may leave the system via admission, discharge or death, or are transferred within the department for further assessment.
Currently, the EU uses two possible treatment pathways for major patients. The first pools the capacity of the HDU and the TB, and thus major patients can been seen in one of 18 physical locations. Recently, the EU has been experimenting with a different patient pathway: the rapid assessment and treatment system. Patients are initially assessed in the HDU, after which they are given a diagnostic test. They are then transferred to TB, where their treatment will continue. From here, they may be discharged, admitted or sent to the MAU or SAU.
Patients on the minors' pathway are treated solely in the minors' department. In the event that admission is required, it is assumed that the patient will go directly to a ward. GP referrals go directly to the MAU or SAU. Major and minor paediatric patients are treated in the paediatric centre.
This project used EU data collected between 1 February 2009 and 12 May 2010. The data are entered on a ‘real time’ basis on to the hospital's patient management system. Manual validation of all patients identified as having stayed >4 h is undertaken retrospectively on a daily basis, with the electronic record amended where there is documentary evidence in the patient's case notes to support this. The dataset contained a detailed description of the arrival and departure process for patients.
Model formulation
The detailed level of data provided a time varying inflow of patients compartmentalised by the six patient streams as well as certain days of the week and time of day. In particular, the following time periods were identified:
-
three periods of the day: 18:00–02:00, 02:00–10:00, 10:00–18:00
-
three periods of the week: Monday, Tuesday–Thursday, Friday–Sunday.
Major paediatric patients and patients in the MAU and SAU require attention from a specialist registrar (SpR). Furthermore, 70% of patients in the MAU and SAU are seen by a consultant. Note that, for clinical reasons, these SpRs and consultants are not pooled between the different units. As medical time is perceived to be a constraint, patients referred by a GP are seen by a nurse assessor before being seen by a registrar.
All other sections of patient care pathways are covered by an EU clinical decision maker (CDM). For the purposes of this work, this was defined as any professional assessed as being clinically competent enough to determine the treatment required by the patient. In the University Hospital of Wales, this incorporates medical staff, consultant nurses and extended nurse practitioners.
It became quickly apparent that the only staffing level that needed consideration was that of CDMs in the A&E. Indeed, it was noted that the efficiency of the EU was not improved by other members of staff past the minimum requirement (one nurse assessor, one registrar and one consultant for each unit).
As is documented in the literature,1 ,2 obtaining valid service time distributions is difficult in emergency departments. Approximations to mean service times and their distributions were obtained from detailed interviews with medical and nursing staff.
Once all of the appropriate inputs had been analysed, the model was built using the computer package Simul8 (http://www.simul8.com/). Validation and verification of this model was not straightforward, as we modelled the EU as it could be and not as it is. This perfect world model corresponds to the assumption that, when patients are ready to be discharged, they are discharged. In reality, there are various downstream blockages that prevent the timely discharge of patients.
Validation is the process of ensuring that the model is sufficiently accurate for the purpose for which it was designed.3 Comparing outputs of the model with empirical values is often used as a form of validation, but this was not possible here because we were modelling how the EU could potentially operate and not replicating the current system. To validate the model, a ‘dark world model’ was created that ensured that the length of stay of all patients was exactly 8 h in each assessment unit. The dark world model was consistent with the occupancy levels of beds in the real world. As such, it was considered that the dark world model justifiably represented the current use of resources. Through thorough investigation and discussion, it was concluded that the conceptual model and its inputs accurately represented the proposed perfect world real world system.
Verification is the process of ensuring that the conceptual model has been accurately represented by the computer model.4 The simulation was continually checked throughout its development by means of structured walk-throughs and continual scrutiny of the model and its results, and thus was successfully verified.
Results
Figure 1 gives the actual daily occupancy of the EU by unit for February 2009. We show the total number of patients present in the EU as well as their distribution in the A&E, MAU and SAU. The extremely high levels of occupancy are noteworthy; during peak times there are as many as 90 patients in the EU.

Average emergency unit occupancy levels by time of day, February 2009. A&E, accident and emergency department; MAU, medical assessment unit; SAU, surgical assessment unit.
Figure 2 shows how these occupancy levels are reflected in the current capacity of the units (based on the physical locations described previously) showing overutilisation of the MAU and SAU.

Percentage of capacity used in the assessment units by time of day, February 2009. MAU, medical assessment unit; SAU, surgical assessment unit.
These high levels of occupancy have a direct effect on the performance targets of the EU.5 As mentioned above, the targets in question in Wales are that 95% of patients must exit the A&E within 4 h and the assessment units within 8 h. Table 1 gives the current target levels as well as the mean time in the system.
Current emergency unit performance by patient stream and discharge destination
These measures will be the main results collected from our simulation model, thus enabling us to compare with the current situation.
With an adequate model of the EU, we were able to attempt multiple staffing scenarios. As noted by Coats and Michalis,2 the staffing patterns should be aligned with the pattern of arrivals. Thus various experiments were run by changing staffing levels in accordance with the aforementioned time compartmentalisation (this gives three shifts a day of 8 h each in duration). As mentioned above, it was noted that the CDM levels were the main decision variables.
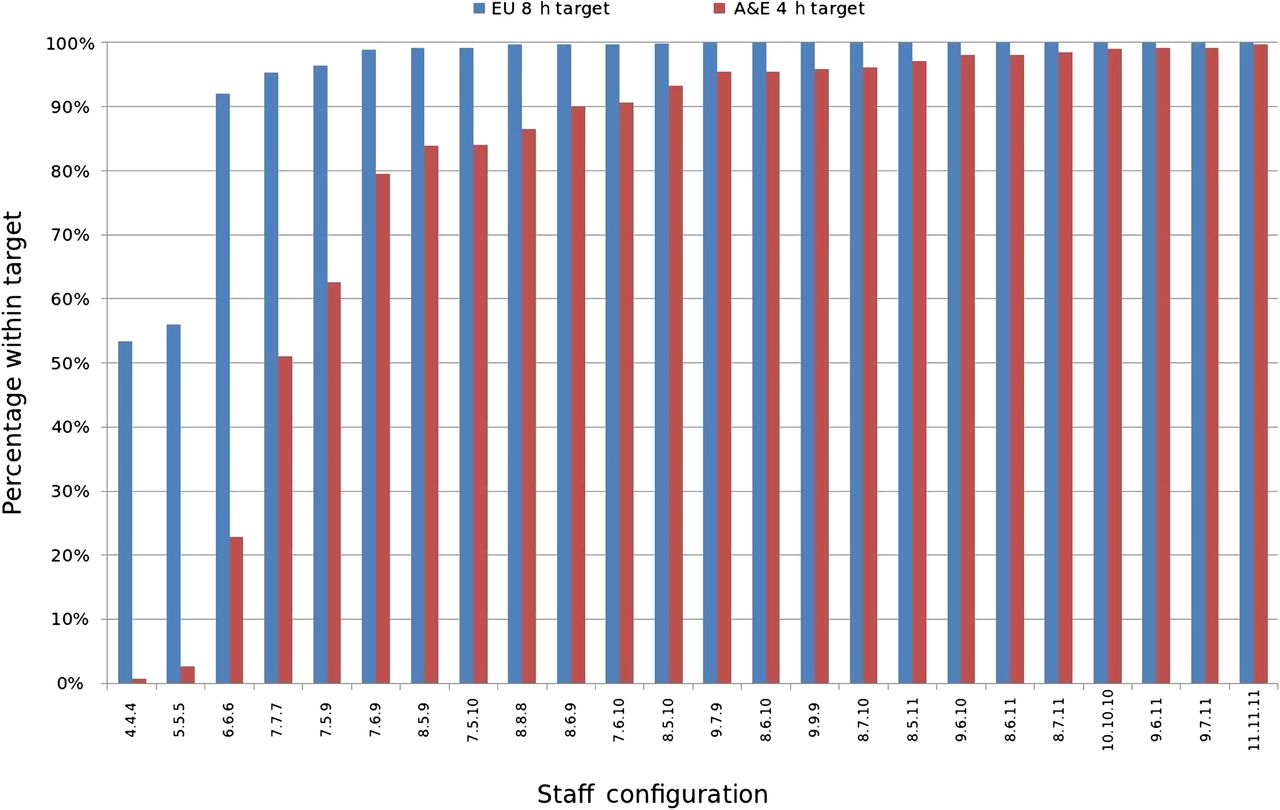
Thus the following notational convention was used. We denoted a staffing pattern having x CDMs on duty between 18:00 and 02:00, y CDMs on duty between 02:00 and 10:00, and z CDMs on duty between 10:00 and 18:00 simply by x.y.z. Figure 3 gives the percentage targets achieved from various staffing patterns (24 different patterns were tried).

Percentage of patients passed through the system within accident and emergency department (A&E) and emergency unit (EU) targets for various levels of staffing.
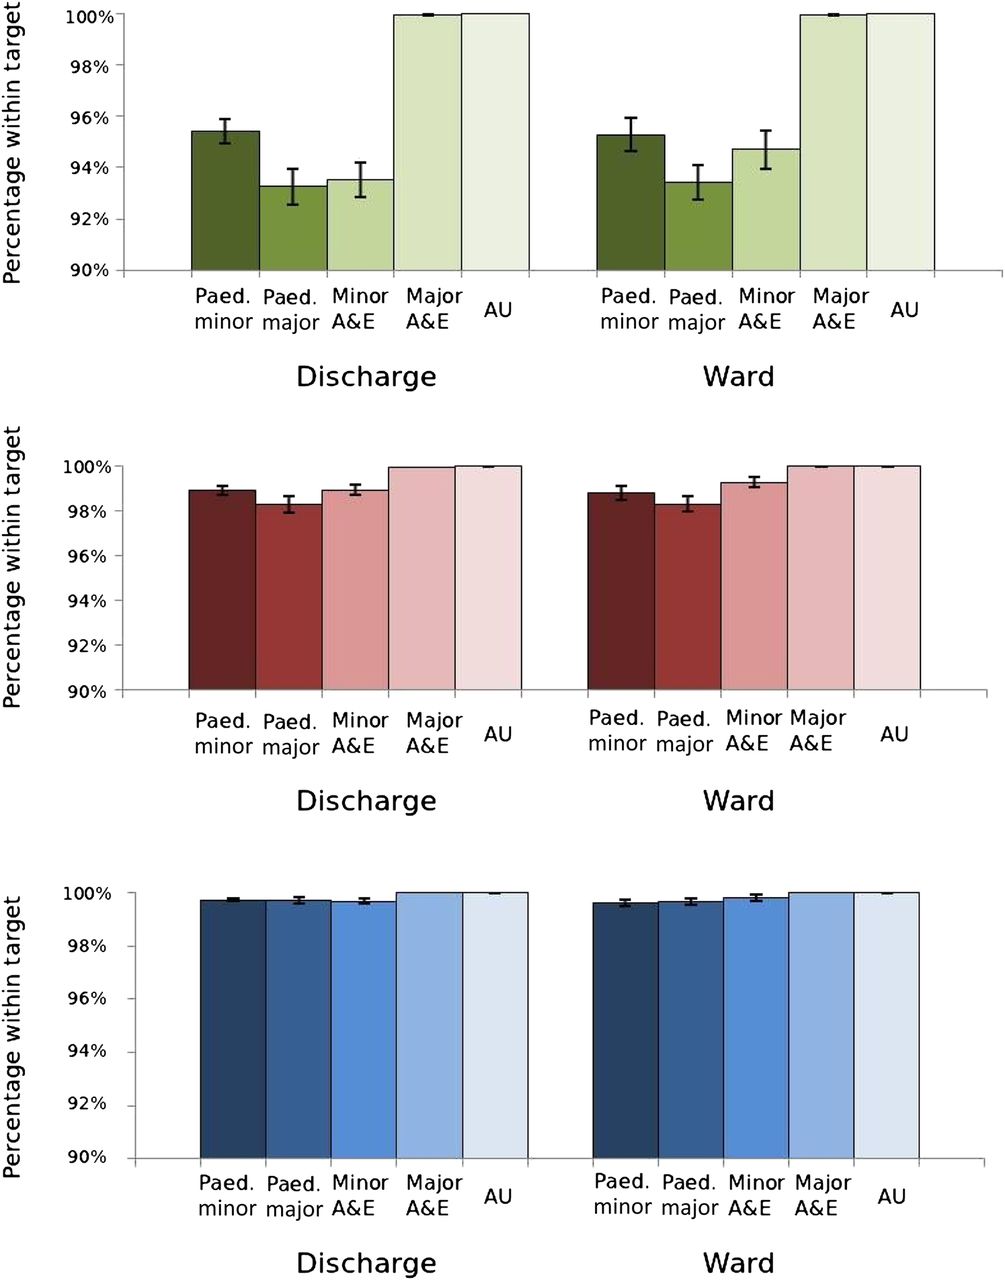
From these results, three further staffing patterns were identified: 8.6.10, 8.6.11 and 9.6.11. The percentages of patients within target are given in figure 4.
Detailed results for three staffing levels (top, 8.6.10; middle, 8.6.11; bottom, 9.6.11). A&E, accident and emergency department; AU, assessment unit; Paed, paediatrics.
The slightly lesser performance levels reached by the minor and paediatric departments can be explained by the modelling assumptions. Indeed, these departments have relatively long service times, and the results from the model show a larger level of occupancy (>80%) than the other departments in question (<30%).
Based solely on these results, the recommended staffing pattern is 8.6.11. The use of this level of staffing ensures that over 98% of patients are within the targets (as opposed to the required 95%) and that the extra member of staff during the night shift is not required. We note that the assessment unit runs extremely efficiently, with all of its patients going through within 8 h; indeed, the majority of patients go through the EU in <100 min.
After discussions with the clinical director of emergency medicine, we made assumptions in the model that 50% of the staff rostered would need to be senior grade medical staff, 25% extended nurse practitioners and 25% middle and junior grade medical staff. Applying this skill mix to the shift patterns identified that the cost of the CDM establishments would need to increase by about £900 000.
We then moved on to determine whether the extra expense incurred by increasing the establishment size of CDM levels could be recouped elsewhere.
Despite the fact that the MAU and SAU require only a minimal number of staff to run efficiently, it was noted that, in a perfect world system, the trolleys are greatly under-used: 30% in the MAU and 25% in the SAU. This is in complete contrast with the actual utilisation shown in figure 2, which is much higher. Multiple simulations were run to evaluate the capacity needed in a perfect world. It was found that, with the CDM rosters set at 8.6.11, the capacity of the TB, MAU and SAU could be modified to four, three and three trolleys, respectively, to give similar performance measures. This reconfiguration corresponds to a 78% reduction in the number of trolleys over these units and a total reduction of 43%.
There are important cost implications associated with these findings: first, with regard to direct nursing costs, where the department, except for the resuscitation unit, operates on an establishment model of one qualified nurse for four trolleys, in addition to nursing auxiliary support; second, as the ability to provide capacity for 10 trolleys can be managed within one unit, rather than the present requirement for it to be spread across three, there is the opportunity to reduce management and administrative costs.
On this basis, we were able to attach a cost to every trolley required for each of the three options under consideration (8.6.10, 8.6.11 and 9.6.11), derive a total cost for each option, and consider this against the improvement in performance identified. The summary results are shown in table 2.
Cost implications of EU reconfiguration
Conservatively, we have estimated that a reduction of 43% (as discussed previously) of the total number of trolleys corresponds to a saving of about £2.5m per year. This is a level of resource that could be invested in the additional CDMs identified as being required to meet demand and then potentially downstream as and where capacity shortfalls are identified. Importantly, this financial impact does not come with any loss of efficiency.
Therefore assuming a perfect world context, where there are sufficient beds within the acute stream to avoid any delays and there is sufficient clinical cover for these beds to cover clinical risks out of hours and at weekends, we identified that there is the potential to realise net efficiency gains of about £1.6m per year in the EU and assessment unit.
The results shown in table 2 now enable the Health Board to understand their choice between financial savings and treatment times in the EU. While moving to a 9.6.11 rota results in the highest levels of access for patients, with 99% being seen within 4 h, the cost is £130 000 greater than the option of delivering services with an 8.6.10 rota, which still achieves the required 95% level of performance.
The results for 8.6.11 would suggest that, now that two factors are being considered, this option is no longer the optimal one, and, if the Health Board wished to increase their level of performance above 95%, it would be in their interests both financially and from a performance perspective to move to a 9.6.11 roster than make a marginal increase to 8.6.11.
Conclusion
EU overcrowding is a recognised problem in many countries, including Australia, USA and the UK, that threatens patient safety.5–7 Multiple factors contribute to the development of overcrowding, including the growth in the number of EU visits, a reduction in the number of EUs, inadequate patient capacity, and increased severity of illness.7 ,8 A number of measures have been undertaken to address the problem of overcrowding. These include increasing capacity in the EU, increasing inpatient capacity, development of observation units, system-wide restructuring, and introduction of early warning systems.8
Identifying the optimal solution to the complex issue of EU overcrowding requires the use of simulation techniques. The objective of the study was to use discrete event simulation to gain a better understanding of how a busy emergency department at a major hospital runs and investigate different strategies to improve quality, performance and efficiency. The usual approach taken in simulation studies is to create a valid representation of the real world, which is then used to run multiple alternatives and investigate potential improvements to the current situation.9–18 Our approach differs. Through in-depth discussions with medical and nursing staff, we were able to model the EU as it could be, and used the model to identify what capacity and staffing were needed to achieve the performance targets. This interactive process highlights how modelling can (and indeed must) be used in conjunction with practitioners. From this approach, we could then compare the perfect world scenario with current service provision and thereby estimate the efficiency gap. In particular, we could assess whether the assessment units were being used as wards, and, most importantly, we could put a financial value on any inefficiency in the emergency department.
Our findings demonstrate that there is a considerable efficiency gap. In response to increased demand and high occupancy rates, planning of the emergency service has focused on increasing trolley capacity and nursing staff, at considerable cost, to support boarding of patients in the emergency department. The perfect world model suggests that, given the demand in a system with no downstream constraints, the optimal solution would be to invest in further CDMs and in actions that would support increased flow of patients from the EU. In addition, this study identifies the potential financial savings, which could be redirected to support the rebalancing of the emergency pathway. It also identifies the considerable improvement in performance that would result.
References
Footnotes
-
Funding VAK is funded by the LANCS initiative (http://www.lancs-initiative.ac.uk).
-
Competing interests None.
-
Provenance and peer review Not commissioned; externally peer reviewed.
Linked Articles
- Primary survey